
Abstract

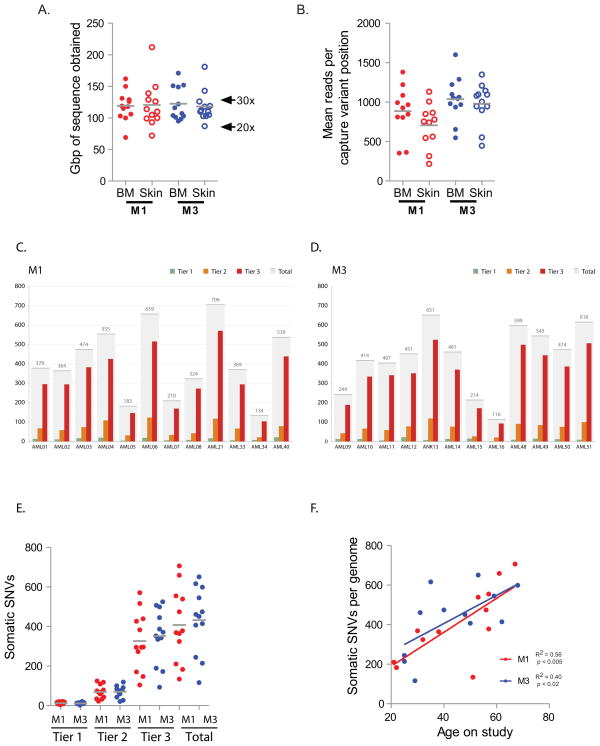
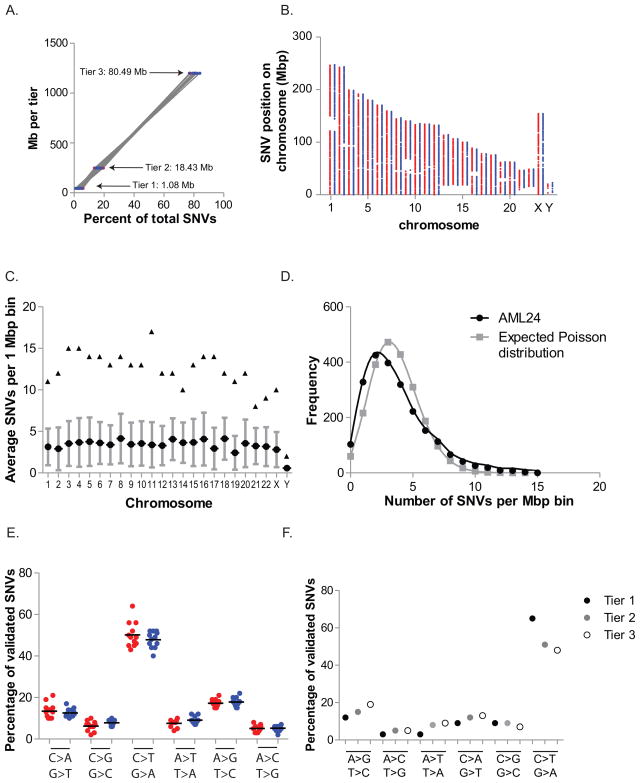
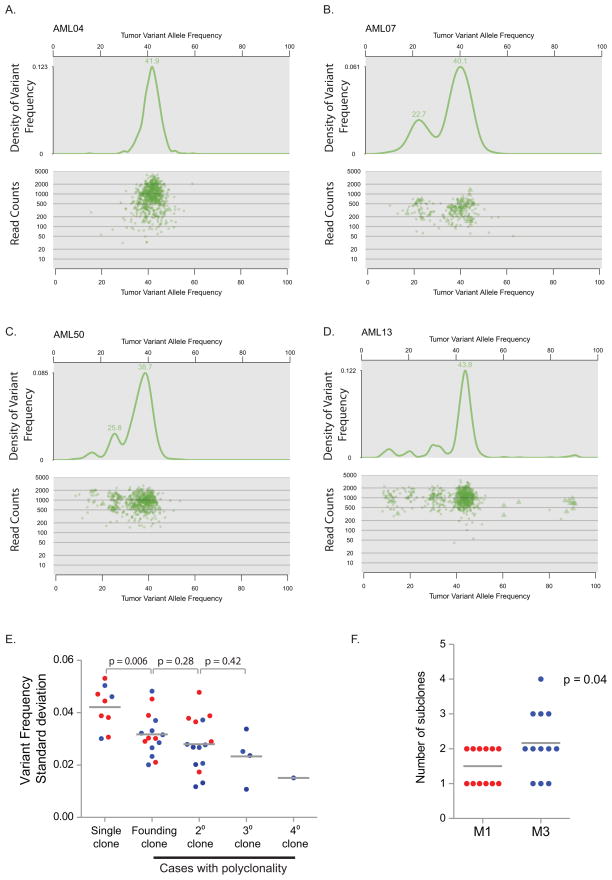
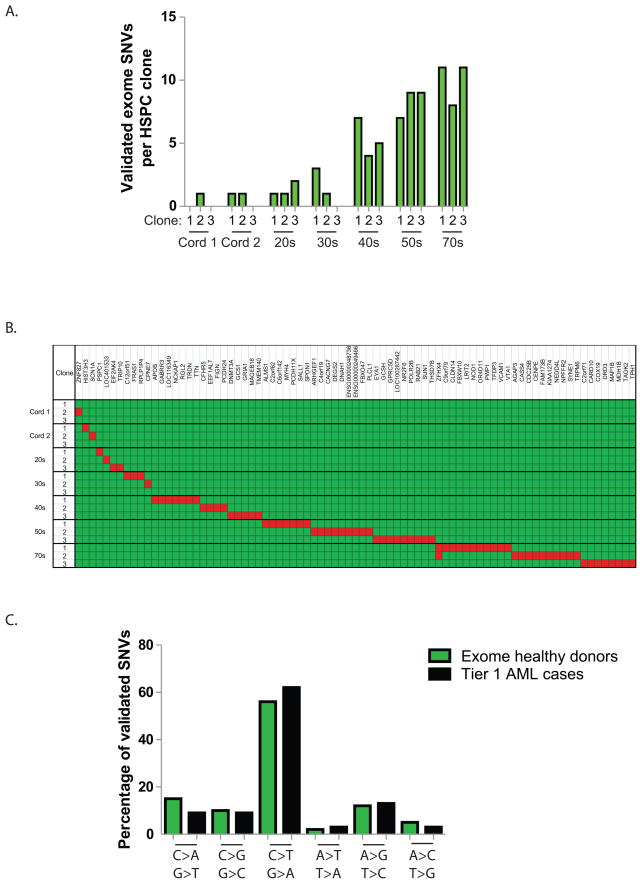
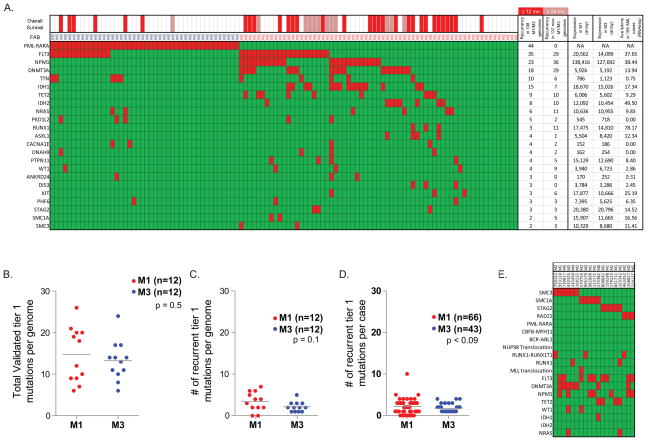
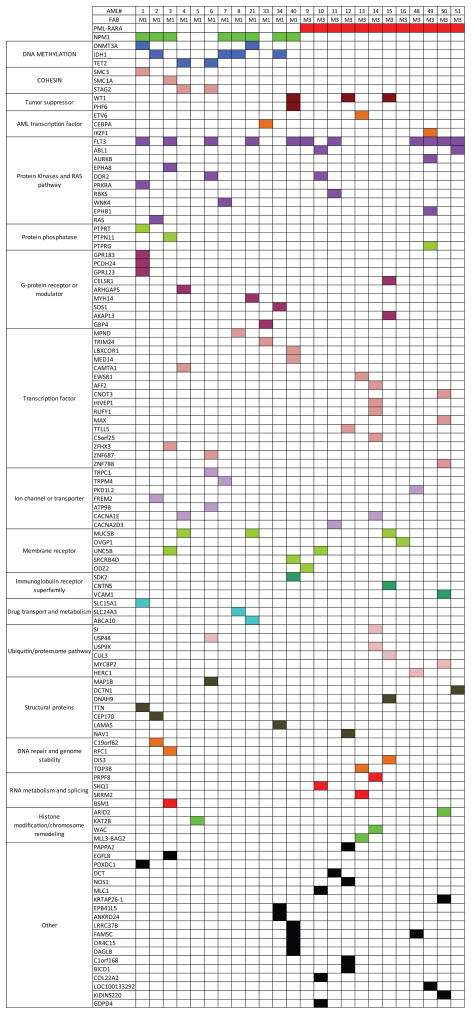
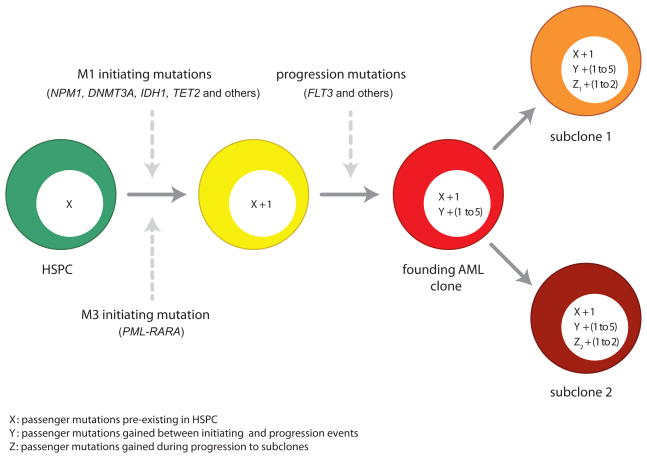
Most mutations in cancer genomes are thought to be acquired after the initiating event, which may cause genomic instability and drive clonal evolution. However, for acute myeloid leukemia (AML), normal karyotypes are common, and genomic instability is unusual. To better understand clonal evolution in AML, we sequenced the genomes of M3-AML samples with a known initiating event (PML-RARA) versus the genomes of normal karyotype M1-AML samples and the exomes of hematopoietic stem/progenitor cells (HSPCs) from healthy people. Collectively, the data suggest that most of the mutations found in AML genomes are actually random events that occurred in HSPCs before they acquired the initiating mutation; the mutational history of that cell is "captured" as the clone expands. In many cases, only one or two additional, cooperating mutations are needed to generate the malignant founding clone. Cells from the founding clone can acquire additional cooperating mutations, yielding subclones that can contribute to disease progression and/or relapse.


Figures

Figure 1
Figure 1. Coverage and number of validated single nucleotide variants (SNVs) by tier per genome
A. Gigabase pairs of sequence obtained for each genome assessed by whole genome sequencing. B. Mean number of reads obtained for each variant assessed per genome during validation. C and D. Number of tier 1, 2, 3, and total variants validated in each sample. E. Total number of validated SNVs by tier in M1 AML (red) versus M3 AML (blue) cases. F. Total number of validated SNVs per genome in non-redundant regions (tier 1, 2, and 3) versus age of patient; M1 AML (red), M3 AML (blue). The R2 for the combined 24 cases is 0.5, p < 0.0001.
Figure 2
Figure 2. Genomic distribution of somatic variants
A. Percentage of validated SNVs in each tier versus the number of genomic megabases occupied by that tier; M1 (red), M3 (blue). Average R2 M1: 0.999 (range: 0.998–1.000); M3: 0.999 (range: 0.998–1.000). B. Distribution of validated SNVs throughout the genome. Each point represents the genomic position of an SNV: X axis represents chromosomes in numerical order; Y axis represents base pair position on each chromosome in megabase pairs; M1 AML (red), M3 AML (blue). The large discontinuous regions represent regions of the reference genome without defined sequence. C. Average (circle), standard deviation (bars), and maximal (triangles) number of SNVs per megabase by chromosome in all 24 cases. D. Frequency of SNVs per megabase of non-tier 4 genomic space compared with the expected Poisson distribution if SNVs were randomly distributed across non-tier 4 space. E. Mutational spectrum of validated SNVs. Percentage of validated SNVs that occur in non-redundant regions of the genome (tiers 1, 2, and 3) with indicated nucleotide changes in M1 AML (red) and M3 AML (blue). F. Mutational spectrum as defined by tier of each event (tier 1, genic; tier 2, highly conserved and/or with regulatory potential; tier 3, unique in the genome, and not in tier 1 or tier 2, see Mardis et. al. 2009 for details).
Figure 3
Figure 3. Clonality assessment in NK M1 AML and t(15;17)-positive M3 AML
A–D. Clusters of variants that occur with similar frequencies identify AML founding clones and subclones. Upper panels: probability density function using kernel density estimation of data in lower panels. The graphed line shows the relative probability of each variant allele frequency in the total sample. Lower panels: for each SNV, the frequency of the variant allele within the bone marrow sample is plotted versus the total number of sequencing reads covering the corresponding nucleotide position. Triangles indicate SNVs on the X chromosome. E. The standard deviation of the variant frequency for each cluster in all 24 cases: M1 AML (red); M3 AML (blue). F. Number of clusters identified by kernel density estimation in M1 AML (red) and M3 AML (blue).
Figure 4
Figure 4. Background mutations in normal HSPCs accumulate as a function of age
A. Number of validated SNVs per exome identified in each of 3 clones that were derived from individual hematopoietic stem/progenitor cells from 7 anonymous, healthy donors with normal blood counts. B. Clustering of mutations by clone. The Y-axis represents the analyzed clones from each donor. The X-axis represents the genes with mutations in each clone (red). Note that the two clones with ZFHX4 variants contained unique mutations (Q1660K vs. P3497A). C. Mutational spectrum in normal donor exomes (81 validated variants) vs. 24 tier 1 AML genomes (343 validated variants).
Figure 5
Figure 5. Recurrently mutated genes in M1 and M3 AML
A. 108 total cases of M1 and M3 AML were screened for somatic variants in the 284 genes identified by WGS and in 53 genes previously reported to be mutated in AML. Mutations with translational consequences that occur in at least three unique genomes are represented in red. FAB subtype indicated above graph. Overall survival is indicated by red (≤ 12 months), pink (12–24 months), and white (> 24 months) bars above graph. B. The total number of validated genic variants per genome identified by WGS in 12 NK M1 AML cases (red) and 12 M3 AML cases (blue), including PML-RARA. C. The total number of recurrently mutated genes per genome identified in 12 NK M1 AML cases (red) and 12 M3 AML cases (blue), including PML-RARA. Only mutations with translational consequences were assessed. D. Total number of recurrently mutated genes per genome identified in 65 M1 AML cases (red) and 43 M3 AML cases (blue), including PML-RARA. Only mutations with translational consequences were assessed. E. Somatic variants in cohesin complex genes (SMC3, SMC1A, STAG2, and RAD21) identified in 199 cases of AML (red). Additional mutations with translational consequences in highly recurrent genes are also shown for each genome (red).
Figure 6
Figure 6. Pathway analysis of key mutations in the 24 sequenced genomes
Mutations identified in Table 1 were individually curated in Pubmed for biological function. Functional categories represented by 2 or fewer mutated genes were excluded. Mutations in NPM1, DNA methylation, and cohesin genes occurred only in the M1 cases, suggesting that they may substitute for PML-RARA as initiating events, or do not productively cooperate with PML-RARA. Mutations in ubiquitin pathway genes occurred more often in M3 AML. Genes representing other functional categories were mutated in both M1 and M3 AML cases.
Figure 7
Figure 7. Integrated model for the origin of driver and passenger mutations during AML evolution
Hematopoietic stem/progenitor cells (HSPCs, shown in green) are long-lived cells that accumulate random, benign background mutations as a function of age. Based on the fact that HSPCs from normal, healthy donors accumulate cell-specific, age-dependent mutations, and that the total mutational burden in AML genomes is related to age, we suggest that the largest numbers of mutations in AML genomes are variants that were preexisting in the cell that received the initiating event. “X” represents these background mutations in the HSPCs, and we estimate that X may range between 100 and 1000 events, depending on age. The initiating mutations, which are drivers, are different for M1 AML cases and M3 AML cases. The initiating event provides an advantage for the affected cell and clonal expansion ensues, so that all of the preexisting mutations are “captured” by cloning. Each progression event gives the expanding clone an additional advantage; based on the data in this paper, we suggest that 1–5 events contribute to progression in most cases of AML. Each progression mutation is expected to capture all mutations that occurred between the initiating event and the progression event (designated as “Y” in the yellow cell). This number would be affected by the time between these events, and the mutation rate in these cells. Although this number is unknown at present, the analysis of clonal progression of secondary AML (Walter et al., 2012) suggests that each progression event may capture dozens to hundreds of mutations. Clonal outgrowth of cells with appropriate progression events results in AML, which is dominated by the “founding” AML clone, designated in red. When this clone is sequenced, the driver mutations (1–6 events) and all associated passenger mutations (hundreds of events) would all be present in all cells within the sample, which is what we observe. Subclones arise from the founding AML clone by acquiring a small number of additional mutations that confer an advantage to that cell, along with any additional background mutations that may have occurred in the interim (represented as “Z”). In this study, the average number of mutations captured in subclones was 40 (range 6–110).

Similar articles

Cited by

  • How aging influences the gut-bone marrow axis and alters hematopoietic stem cell regulation.
    Wells C, Robertson T, Sheth P, Abraham S. Wells C, et al. Heliyon. 2024 Jun 11;10(12):e32831. doi: 10.1016/j.heliyon.2024.e32831. eCollection 2024 Jun 30. Heliyon. 2024. PMID: 38984298 Free PMC article. Review.
  • Next generation sequencing of acute myeloid leukemia: influencing prognosis.
    Ilyas AM, Ahmad S, Faheem M, Naseer MI, Kumosani TA, Al-Qahtani MH, Gari M, Ahmed F. Ilyas AM, et al. BMC Genomics. 2015;16 Suppl 1(Suppl 1):S5. doi: 10.1186/1471-2164-16-S1-S5. Epub 2015 Jan 15. BMC Genomics. 2015. PMID: 25924101 Free PMC article. Review.
  • Genomic and epigenomic landscapes of adult de novo acute myeloid leukemia.
    Cancer Genome Atlas Research Network; Ley TJ, Miller C, Ding L, Raphael BJ, Mungall AJ, Robertson A, Hoadley K, Triche TJ Jr, Laird PW, Baty JD, Fulton LL, Fulton R, Heath SE, Kalicki-Veizer J, Kandoth C, Klco JM, Koboldt DC, Kanchi KL, Kulkarni S, Lamprecht TL, Larson DE, Lin L, Lu C, McLellan MD, McMichael JF, Payton J, Schmidt H, Spencer DH, Tomasson MH, Wallis JW, Wartman LD, Watson MA, Welch J, Wendl MC, Ally A, Balasundaram M, Birol I, Butterfield Y, Chiu R, Chu A, Chuah E, Chun HJ, Corbett R, Dhalla N, Guin R, He A, Hirst C, Hirst M, Holt RA, Jones S, Karsan A, Lee D, Li HI, Marra MA, Mayo M, Moore RA, Mungall K, Parker J, Pleasance E, Plettner P, Schein J, Stoll D, Swanson L, Tam A, Thiessen N, Varhol R, Wye N, Zhao Y, Gabriel S, Getz G, Sougnez C, Zou L, Leiserson MD, Vandin F, Wu HT, Applebaum F, Baylin SB, Akbani R, Broom BM, Chen K, Motter TC, Nguyen K, Weinstein JN, Zhang N, Ferguson ML, Adams C, Black A, Bowen J, Gastier-Foster J, Grossman T, Lichtenberg T, Wise L, Davidsen T, Demchok JA, Shaw KR, Sheth M, Sofia HJ, Yang L, Downing JR, Eley G. Cancer Genome Atlas Research Network, et al. N Engl J Med. 2013 May 30;368(22):2059-74. doi: 10.1056/NEJMoa1301689. Epub 2013 May 1. N Engl J Med. 2013. PMID: 23634996 Free PMC article.
  • OTS167 blocks FLT3 translation and synergizes with FLT3 inhibitors in FLT3 mutant acute myeloid leukemia.
    Eisfelder BJ, Saygin C, Wynne J, Colton MW, Fischietti M, Beauchamp EM, Cheng JX, Odenike O, Roboz G, Alachkar H, Stock W. Eisfelder BJ, et al. Blood Cancer J. 2021 Mar 3;11(3):48. doi: 10.1038/s41408-021-00433-3. Blood Cancer J. 2021. PMID: 33658483 Free PMC article.
  • Clonal Hematopoiesis of Indeterminate Potential in Patients with Solid Tumor Malignancies.
    Marshall CH, Gondek LP, Luo J, Antonarakis ES. Marshall CH, et al. Cancer Res. 2022 Nov 15;82(22):4107-4113. doi: 10.1158/0008-5472.CAN-22-0985. Cancer Res. 2022. PMID: 36040522 Free PMC article.

References

    1. Abkowitz JL, Catlin SN, Guttorp P. Evidence that hematopoiesis may be a stochastic process in vivo. Nat Med. 1996;2:190–197. - PubMed
    1. Abkowitz JL, Golinelli D, Harrison DE, Guttorp P. In vivo kinetics of murine hemopoietic stem cells. Blood. 2000;96:3399–3405. - PubMed
    1. Abramson JH. WINPEPI updated: computer programs for epidemiologists, and their teaching potential. Epidemiol Perspect Innov. 2011;8:1. - PMC - PubMed
    1. Allford S, Grimwade D, Langabeer S, Duprez E, Saurin A, Chatters S, Walker H, Roberts P, Rogers J, Bain B, et al. Identification of the t(15;17) in AML FAB types other than M3: evaluation of the role of molecular screening for the PML/RARalpha rearrangement in newly diagnosed AML. The Medical Research Council (MRC) Adult Leukaemia Working Party. Br J Haematol. 1999;105:198–207. - PubMed
    1. Armitage P, Doll R. A two-stage theory of carcinogenesis in relation to the age distribution of human cancer. Br J Cancer. 1957;11:161–169. - PMC - PubMed

Publication types

Substances