. 2012 Oct;86(19):10606-20.
doi: 10.1128/JVI.01391-12. Epub 2012 Jul 18.

TNFRSF25 agonistic antibody and galectin-9 combination therapy controls herpes simplex virus-induced immunoinflammatory lesions

Affiliations

TNFRSF25 agonistic antibody and galectin-9 combination therapy controls herpes simplex virus-induced immunoinflammatory lesions

Pradeep B J Reddy et al. J Virol. 2012 Oct.

Abstract

Ocular infection with herpes simplex virus 1 (HSV-1) results in a chronic immunoinflamammtory reaction in the cornea, which is primarily orchestrated by CD4(+) T cells. Hence, targeting proinflammatory CD4(+) T cells or increasing the representation of cells that regulate their function is a relevant therapeutic strategy. In this report, we demonstrate that effective therapeutic control can be achieved using a combination of approaches under circumstances where monotherapy is ineffective. We use a convenient and highly effective monoclonal antibody (MAb) approach with MAbT25 to expand cells that express the tumor necrosis factor receptor superfamily member 25 (TNFRSF25). In naïve animals, these are predominantly cells that are Foxp3-positive regulatory T cells. MAbT25 treatment before or at the time of initial HSV infection was an effective means of reducing the severity of subsequent stromal keratitis lesions. However, MAbT25 treatment was not effective if given 6 days after infection since it expanded proinflammatory effector T cells, which also express TNFRSF25. Therefore, the MAbT25 procedure was combined with galectin-9 (Gal-9), an approach that compromises the activity of T cells involved in tissue damage. The combination therapy provided highly effective lesion control over that achieved by treatment with one of them. The beneficial outcome of the combination therapy was attributed to the expansion of the regulatory T cell population that additionally expressed activation markers such as CD103 needed to access inflammatory sites. Additionally, there was a marked reduction of CD4(+) gamma interferon-producing effector T cells responsible for orchestrating the tissue damage. The approach that we describe has potential application to control a wide range of inflammatory diseases, in addition to stromal keratitis, an important cause of human blindness.


Figures

Fig 1
Fig 1
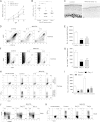
MAbT25 induces rapid expansion of CD4+ Foxp3+ cells in HSV-1-infected mice. To demonstrate the effect of MAbT25 on Treg expansion in HSV-1-infected mice, Foxp3-GFP mice were infected with HSV-1 and injected i.p. with a single dose of MAbT25 or isotype on day 1 p.i. (A) FACS plots showing Foxp3+ T cells in blood and spleen at different time points in HSV-1-infected mice treated with MAbT25; (B) kinetics of Treg expansion in peripheral blood and spleen of HSV-1-infected mice treated with MAbT25; (C) kinetics of Treg expansion in the peripheral blood and spleen of MAbT25-treated naïve mice. Data represent means ± SEMs of at least two independent experiments with ≥15 mice per group. At least 3 mice were sacrificed at each time point to isolate spleens and blood to measure Treg frequencies. Statistical significance was calculated by Student's t test at each time point between the spleen samples isolated from isotype- and MAbT25-treated groups (***, P < 0.0001).
Fig 2
Fig 2
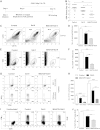
MAbT25 administration before or following HSV infection reduces the severity of SK lesions. C57BL/6 mice infected with HSV-1 were treated with MAbT25 or isotype antibody either 2 days before infection or at 8 h p.i. (A) SK disease progression was scored at different time points starting from day 8 p.i. until day 15 p.i. (n = 5 to 6 mice per group). DPI, day postinfection. Two-way ANOVA with Bonferroni's multiple-comparison test was used to calculate significance between the groups (**, P < 0.01; ***, P < 0.001). (B) Individual SK lesion scores of MAbT25-treated and control mice on day 15 p.i. One-way ANOVA with Tukey's posttest was performed to calculate significance between control and MAbT25-treated groups (**, P < 0.01; ***, P < 0.001). (C) Eyes from different groups of treated and control mice were extirpated on day 15 p.i., and images for pathology analysis were taken at different microscope augmentations using a ×40 objective. (D to I) HSV-infected corneas were harvested on day 15 p.i., processed, and stained for different cell surface molecules. (D) FACS plots represent the frequencies of neutrophils in various groups (D, day); (E) bar graphs showing number of neutrophils in the MAbT25-treated group and control groups; (F) FACS plots showing frequencies of CD4+ T cells (SSC, side scatter); (G) bar graphs representing CD4+ T cell numbers in the cornea; (H) FACS plots showing IFN-γ-producing CD4+ T cells (top, IFN-γ+ cells on HSV-1 stimulation; bottom, IFN-γ+ cells on PMA-ionomycin stimulation); (I) bar graphs depicting the numbers of CD4+ IFN-γ+ cells. Statistical significance was calculated by one-way ANOVA with Tukey's multiple-comparison test (***, P < 0.001). (J) FACS plots showing the CD4+ T cell population (DLN) expressing CD44 and CD62L markers. (K) FACS profiles showing the frequencies of CD4+ T cells (DLN) producing IFN-γ on PMA-ionomycin stimulation in MAbT25-treated and control groups. Experiments were repeated 3 times with 5 to 6 mice per group. Data represent means ± SEMs of at least two independent experiments.
Fig 3
Fig 3
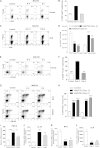
MAbT25 treatment increased the frequencies of the Treg population in the cornea and draining lymph nodes. C57BL/6 mice infected with HSV-1 were treated with MAbT25 or isotype antibody on day −2 or on day 0 (8 h p.i.). HSV-infected corneas were processed and stained for Treg population. (A) FACS plots showing CD4+ Foxp3+ Tregs in the corneas of control and MAbT25-treated groups. (B) Bar graphs representing the percentage of Foxp3+ cells. (C) FACS plots showing CD4+ Foxp3+ Tregs in the DLNs of control and MAbT25-treated groups. (D) Bar graphs representing the numbers of CD4+ Foxp3+ and CD4+ IFN-γ+ T cells in DLNs. (E) FACS profiles of CD4+ Foxp3+ Tregs expressing CD103 in the corneas of control and MAbT25-treated groups. (F) Bar graphs showing the frequencies of CD4+ Foxp3+ Tregs expressing CD103. (G) FACS profiles of CD4+ Foxp3+ Tregs expressing CD103 in the DLNs of control and MAbT25-treated groups. (H) Bar graphs showing the frequencies of CD4+ Foxp3+ Tregs expressing CD103. (I to L) The relative fold change in the expression of mRNA of various cytokines was examined and compared between the control and treated groups on day 15 p.i. by qPCR. mRNA levels for the different cytokines in mock-infected mice were set to 1 and used to determine the relative fold upregulation. Relative mRNA expression of TGF-β (I), IL-10 (J), IFN-γ (K), and IL-6 (L) in MAbT25 and control groups. Each experiment was repeated at least three times with 5 to 6 mice per group per experiment. Data represent means ± SEMs of triplicate wells with 5 to 6 pooled corneas per group from three independent experiments. Statistical significance was calculated by one-way ANOVA with Tukey's multiple-comparison test (ns, not significant; *, P < 0.05; **, P < 0.01; ***, P < 0.0001).
Fig 4
Fig 4
MAbT25 administration during early clinical phase of disease was not effective in controlling the severity of SK lesions. (A) C57BL/6 mice infected with 1 × 10⁴ PFU HSV-1 were treated with MAbT25 or isotype antibody on day 6 p.i. (B) SK lesion scores of MAbT25-treated and control mice on day 15 p.i. Experiments were repeated three times with 8 to 10 mice per group. One-way ANOVA with Tukey's multiple-comparison test was used to calculate significance (P value not significant, P > 0.05). (C to F) HSV-infected corneas were pooled and processed as previously described for FACS analysis. (C) FACS plots showing neutrophils in the corneas of control and MAbT25-treated groups; (D) bar graphs showing neutrophil numbers; (E) FACS plots showing the total CD4+ T cells in the corneas; (F) bar graphs showing CD4+ T cell numbers. (G) Representative FACS plots showing CD4+ IFN-γ+ cells. (Top) IFN-γ+ cells on HSV-1 stimulation; (bottom) PMA-ionomycin stimulation in MAbT25-treated and control groups. (H) Bar graphs representing CD4+ IFN-γ+ T cell numbers. (I) FACS plots showing Foxp3+ Tregs in the corneas of control and MAbT25-treated groups. (J) Bar graphs representing numbers of Foxp3+T cells. Data represent means ± SEMs of 6 to 8 mice per group from at least two independent experiments. Statistical levels of significance were calculated by Student's t test (*, P < 0.05; ***, P < 0.0001).
Fig 5
Fig 5
Comparison of CD4+ T cell responses in prophylactic and therapeutic settings following MAbT25 administration. To determine the subset of CD4+ T cells proliferating in MAbT25-treated animals following the two treatment modalities (on day −2 or day 6 p.i.), a BrdU proliferation assay was performed. HSV-infected Foxp3-GFP mice were treated with MAbT25 (day −2). BrdU was injected on day 4 after MAbT25 treatment. Another group of mice received MAbT25 on day 6 p.i. and BrdU on day 9 p.i. (A) FACS profiles showing BrdU incorporation in CD4+ Foxp3+ and CD4+ Foxp3 T cells in mice treated with MAbT25 on day −2; (B) bar graphs representing frequencies of CD4+ Foxp3+ and CD4+ Foxp3 cells; (C) FACS profiles showing BrdU incorporation in CD4+ Foxp3+ and CD4+ Foxp3 cells from the mice treated with MAbT25 on day 6 p.i.; (D) bar graphs representing frequencies of CD4+ Foxp3+ and CD4+ Foxp3 T cells. (E and F) DLN samples isolated from MAbT25 and isotype-treated mice on day 15 p.i. were stimulated with UV-inactivated HSV-1; (E) FACS profiles showing frequencies of CD4+ T cells producing IFN-γ; (F) bar graphs representing frequencies of IFN-γ-producing CD4+ T cells. (G) Bar graphs showing MFI levels of IFN-γ. Data represent means ± SEMs of at least two independent experiments. Statistical significance was calculated by Student's t test (*, P < 0.05; **, P < 0.01; ***, P < 0.001).
Fig 6
Fig 6
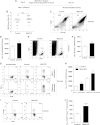
MAbT25 and rGal-9 combination therapy effectively reduced SK lesion severity in a therapeutic setting. (A) HSV-infected C57BL/6 mice were injected with a single dose of MAbT25 or isotype control antibody on day 6 p.i., and starting from day 6, these mice also received rGal-9 (50 μg/mouse) until day 14 p.i. Another group of mice was treated with rGal-9 (100 μg/mouse) alone starting from day 6 p.i., and disease progression was observed until day 15 p.i. (B) Individual SK lesion scores of MAbT25–Gal-9-, Gal-9-, and isotype-treated groups on day 15 p.i. Experiments were repeated three times with 8 to 10 mice per group. One-way ANOVA with Tukey's multiple-comparison test was used to calculate the level of significance (*, P < 0.05; ***, P <0.001). (C to H) HSV-infected corneas were harvested and processed as previously indicated for FACS analysis; (C) FACS plots showing neutrophils infiltrated into the corneas of various groups; (D) bar graphs representing numbers of neutrophils in various groups; (E) FACS plots showing CD4+ T cells in the corneas of various groups; (F) bar graphs representing total CD4+ T cell numbers in the cornea; (G) FACS plots showing IFN-γ-producing CD4+ T cells (top, IFN-γ+ cells on HSV-1 stimulation; bottom, IFN-γ+ cells on PMA-ionomycin stimulation); (H) bar graphs depicting CD4+ IFN-γ+ T cell numbers. (I) FACS profiles showing frequencies of CD4+ T cells producing IFN-γ in DLNs; (J) bar graphs representing their frequencies. Data represent means ± SEMs of 5 to 6 mice per group from at least two independent experiments. One-way ANOVA with Tukey's multiple-comparison test was used to calculate the level of significance (**, P < 0.01; ***, <0.0001).
Fig 7
Fig 7
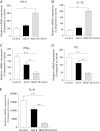
MAbT25–Gal-9 combination therapy reduced the expression of proinflammatory cytokines and upregulated anti-inflammatory cytokine expression. C57BL/6 mice were injected with MAbT25 or isotype antibody on day 6 p.i., and starting from day 6, these mice also received rGal-9 (50 μg/mouse) until day 14 p.i. Another group of mice received Gal-9 alone starting from day 6 until day 14 p.i. The relative fold change in expression of mRNA of various cytokines was examined and compared between control and treated groups on day 15 p.i. by qPCR. mRNA levels for the different cytokines in mock-infected mice were set to 1 and used to determine the relative fold upregulation. Relative mRNA expression of TGF-β (A), IL-10 (B), IFN-γ (C), KC (D), and IL-6 (E) in MAbT25–Gal-9-, Gal-9-, and isotype-treated groups. Data represent means ± SEMs of 5 to 6 corneas per group from at least two independent experiments. Statistical significance was calculated by one-way ANOVA with Tukey's multiple-comparison test (**, P < 0.01; ***, <0.001).
Fig 8
Fig 8
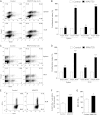
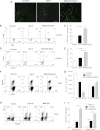
MAbT25 and Gal-9 combination therapy expanded the Treg population in the corneas and DLNs. (A) Foxp3-GFP mice infected with HSV-1 were treated with MAbT25 on day 6 p.i., and starting from day 6, these mice also received rGal-9. Another group of mice received Gal-9 alone starting from day 6 until day 14 p.i. (A) On day 15 p.i., the mice were sacrificed and the corneas were isolated and directly examined under a confocal microscope (Leica SP2 LSCM) for GFP-expressing Foxp3+ Tregs. (B to E) HSV-infected corneas were harvested and processed as previously indicated for FACS analysis; (B) FACS plots showing Foxp3+ Tregs in the corneas of MAbT25–Gal-9-, Gal-9-, and isotype-treated groups; (C) bar graphs showing the percentage of CD4+ Foxp3+ cells; (D) FACS profiles of Foxp3+ Tregs expressing CD103 in the corneas of various groups; (E) bar graphs showing the numbers of Foxp3+ Tregs expressing CD103 in the corneas of various groups. (F) FACS plots showing CD4+ Foxp3+ Tregs in the DLNs of MAb T25–Gal-9-, Gal-9-, and isotype-treated groups. (G) Bar graphs showing the numbers of Foxp3+ CD4+ T cells and Th1 cells in DLNs. (H and I) Two groups of mice were infected with HSV-1, and on day 6 p.i., one group of mice was treated with MAbT25 and another group received isotype control. DLNs of mice were analyzed for Tim-3 expression on day 12 p.i.; (H) FACS profiles of CD4+ T cells expressing Tim-3 marker in the DLNs; (I) bar graphs representing the percentage of CD4+ Foxp3+ and CD4+ Foxp3 T cells expressing the Tim-3 marker. Data represent means ± SEMs of 3 to 4 mice per group from at least two independent experiments. Statistical significance was calculated by one-way ANOVA with Tukey's multiple-comparison test (*, P < 0.05; **, P < 0.01; ***, P < 0.001).
Fig 9
Fig 9
MAbT25-induced upregulation of Tim-3 expression on effector T cells increased their susceptibility to Gal-9-induced apoptosis. Two groups of Foxp3-GFP mice were infected with HSV-1, and on day 6 p.i., one group of mice was treated with MAbT25 or isotype antibody. DLNs were isolated on day 12 p.i. to check the susceptibility of CD4+ Foxp3 and CD4+ Foxp3+ T cells to Gal-9-induced apoptosis. (A) FACS profiles of CD4+ T cells that are Tim-3 or annexin V positive from MAbT25-treated (top) and isotype-treated (bottom) groups; (B) bar graphs representing the percentage of CD4+ annexin V-positive cells from MAbT25-treated and isotype-treated groups; (C) FACS profiles of CD4+ Foxp3+ T cells MAbT25-treated (top) and isotype-treated (bottom) groups undergoing apoptosis; (D) bar graphs representing the percentage of CD4+ Foxp3+ T cells. Experiments were repeated 2 times with 3 to 4 mice each group. Data represent the means ± SEMs. Student's t test was performed to determine statistical significance, and data are expressed as means ± SEMs (***, P < 0.0001). (E and F) Tregs isolated from DLNs of MAbT25- and Gal-9-treated group are highly suppressive. Foxp3-GFP mice infected with HSV-1 were treated with MAbT25 on day 6 p.i., and starting from day 6, these mice also received rGal-9 (50 μg/mouse) until day 14 p.i. Another group of mice received Gal-9 alone. CD4+ Foxp3+ T cells were sorted and cultured with CFSE-labeled CD4+ CD25 Thy1.1 responder cells (Treg/Tconv, 1:1 to 1:16) in the presence of anti-CD3 and anti-CD28 antibodies. (E) Representative histograms showing the extent of CFSE dilution at a 1:4 Treg/effector T cell (Teff) ratio. (F) Bar graphs showing the percent suppression of Tregs isolated from MAbT25–Gal-9-, Gal-9-, and isotype-treated groups. Each experiment was repeated at least two times with at least 3 mice per group. Data represent means ± SEMs of at least two independent experiments. Statistical significance was calculated by one-way ANOVA with Tukey's multiple-comparison test (**, P < 0.01).

Similar articles

Cited by

References

    1. Anderson AC, Anderson DE. 2006. TIM-3 in autoimmunity. Curr. Opin. Immunol. 18:665–669 - PubMed
    1. Blaskó A, Fajka-Boja R, Ion G, Monostori E. 2011. How does it act when soluble? Critical evaluation of mechanism of galectin-1 induced T-cell apoptosis. Acta Biol. Hung. 62:106–111 - PubMed
    1. Bull MJ, et al. 2008. The death receptor 3-TNF-like protein 1A pathway drives adverse bone pathology in inflammatory arthritis. J. Exp. Med. 205:2457–2464 - PMC - PubMed
    1. Chinnaiyan AM, et al. 1996. Signal transduction by DR3, a death domain-containing receptor related to TNFR-1 and CD95. Science 274:990–992 - PubMed
    1. Crawford A, Wherry EJ. 2007. Inhibitory receptors: whose side are they on? Nat. Immunol. 8:1201–1203 - PubMed

Publication types

MeSH terms