

Pharmacodynamic and antiretroviral activities of combination nanoformulated antiretrovirals in HIV-1-infected human peripheral blood lymphocyte-reconstituted mice
- PMID: 22811299
- PMCID: PMC3570176
- DOI: 10.1093/infdis/jis395
Pharmacodynamic and antiretroviral activities of combination nanoformulated antiretrovirals in HIV-1-infected human peripheral blood lymphocyte-reconstituted mice
Abstract
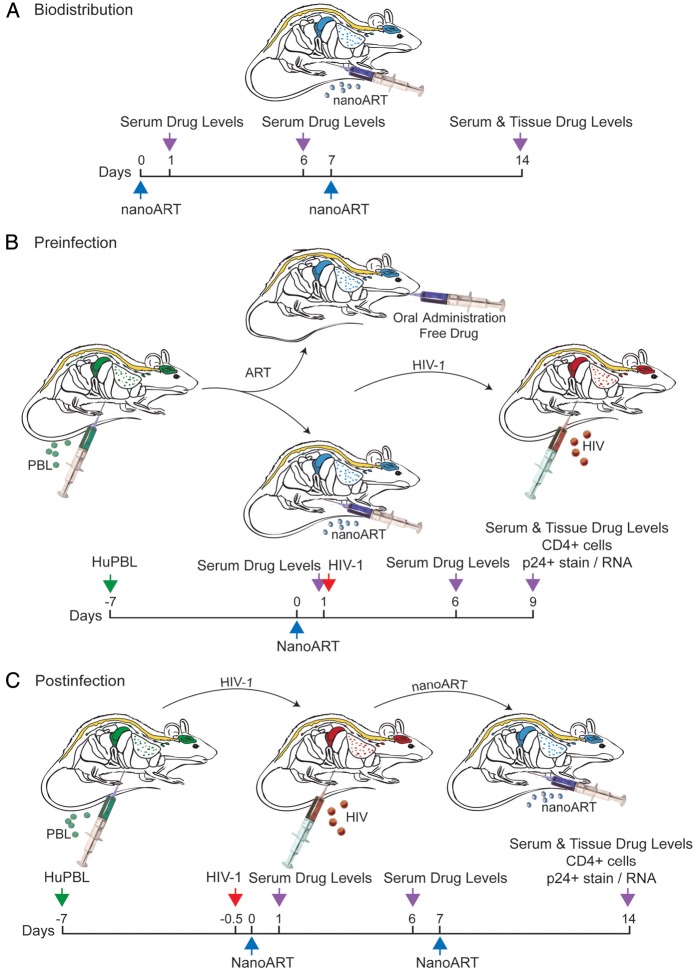
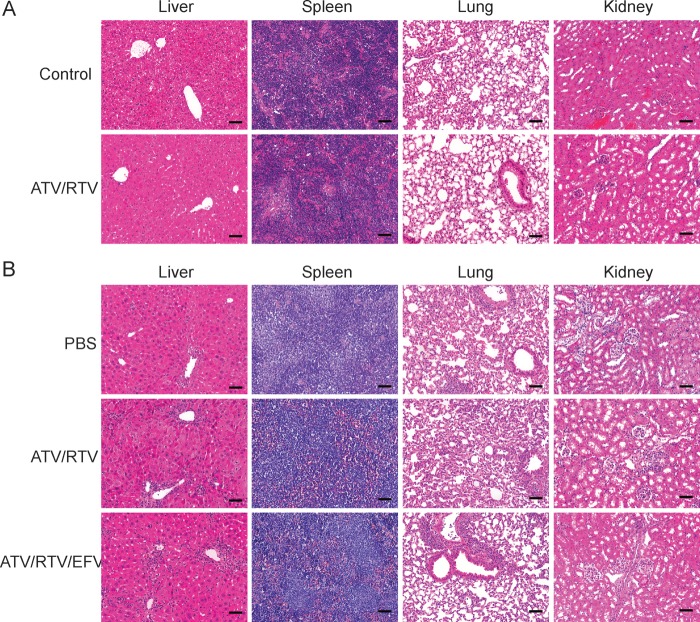
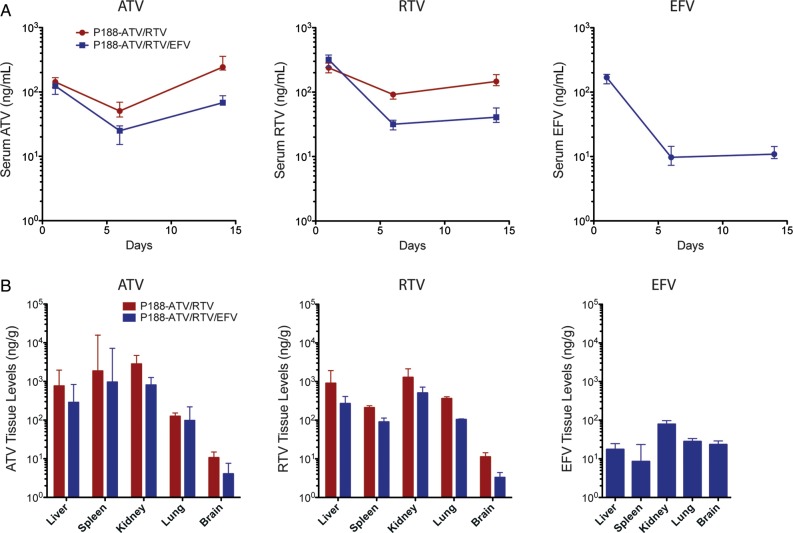
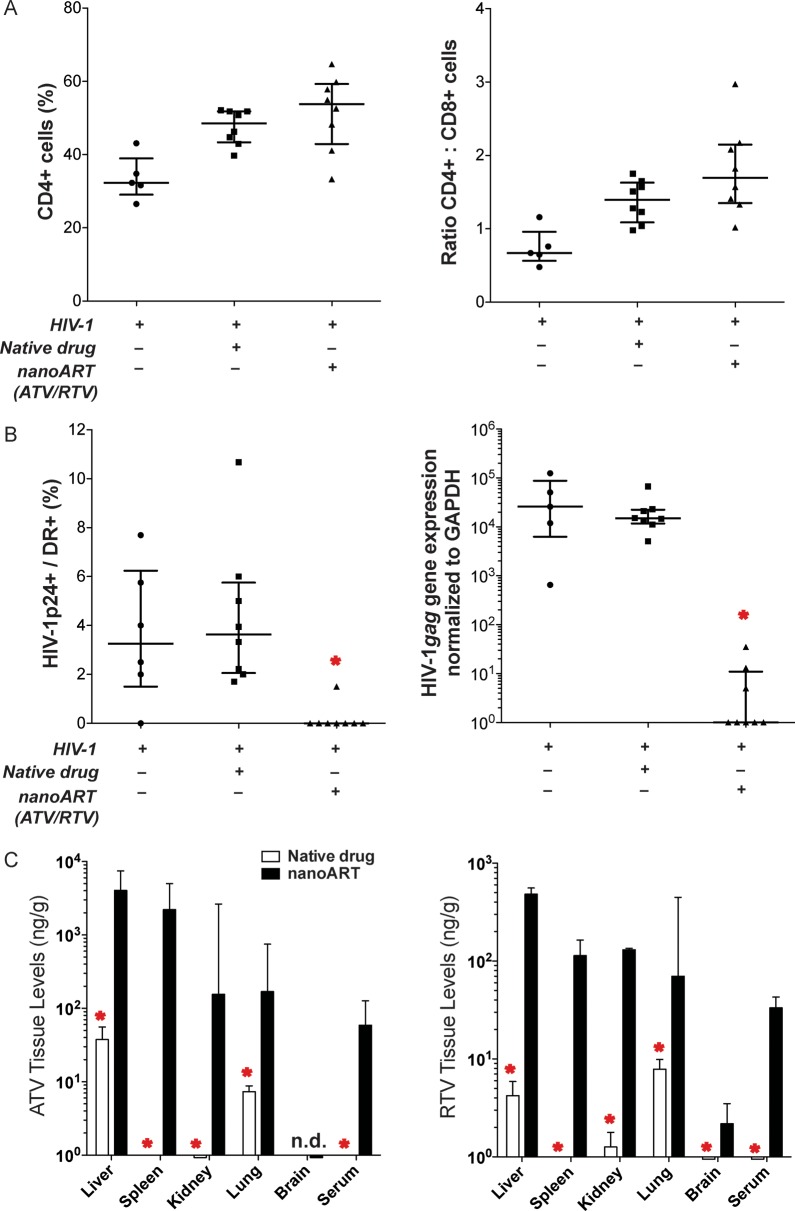
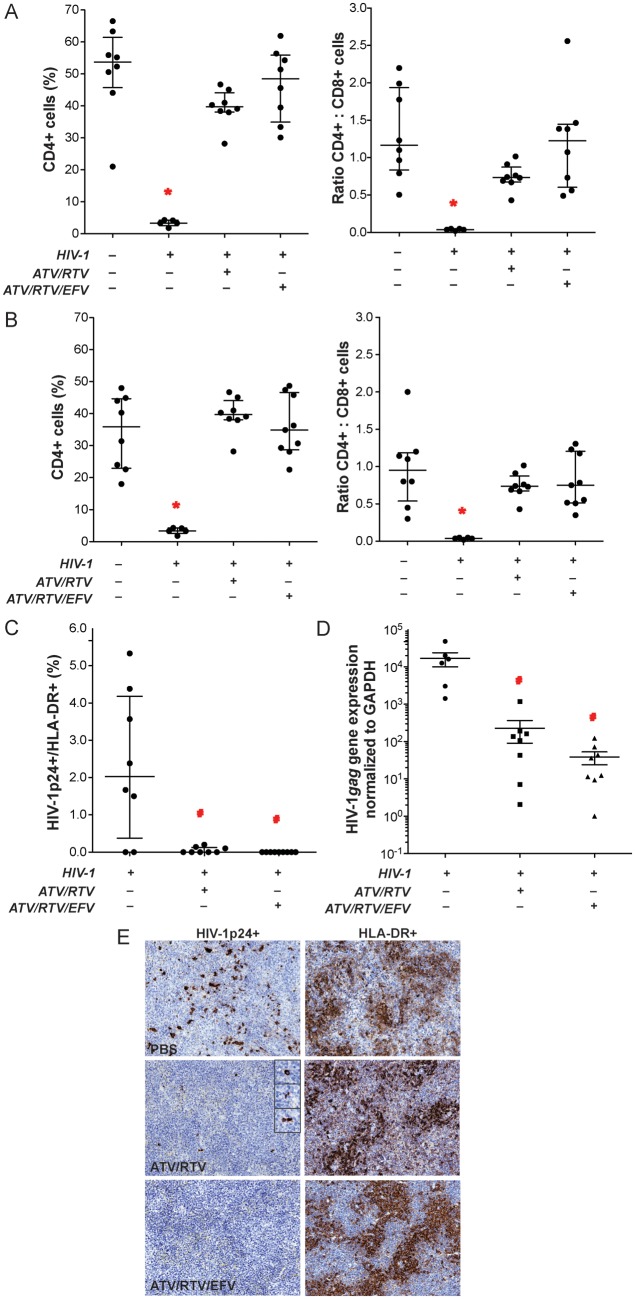
Lack of adherence, inaccessibility to viral reservoirs, long-term drug toxicities, and treatment failures are limitations of current antiretroviral therapy (ART). These limitations lead to increased viral loads, medicine resistance, immunocompromise, and comorbid conditions. To this end, we developed long-acting nanoformulated ART (nanoART) through modifications of existing atazanavir, ritonavir, and efavirenz suspensions in order to establish cell and tissue drug depots to achieve sustained antiretroviral responses. NanoART's abilities to affect immune and antiviral responses, before or following human immunodeficiency virus type 1 infection were tested in nonobese severe combined immune-deficient mice reconstituted with human peripheral blood lymphocytes. Weekly subcutaneous injections of drug nanoformulations at doses from 80 mg/kg to 250 mg/kg, 1 day before and/or 1 and 7 days after viral exposure, elicited drug levels that paralleled the human median effective concentration, and with limited toxicities. NanoART treatment attenuated viral replication and preserved CD4(+) Tcell numbers beyond that seen with orally administered native drugs. These investigations bring us one step closer toward using long-acting antiretrovirals in humans.
Figures

Similar articles
-
Long-acting nanoformulated antiretroviral therapy elicits potent antiretroviral and neuroprotective responses in HIV-1-infected humanized mice.AIDS. 2012 Nov 13;26(17):2135-44. doi: 10.1097/QAD.0b013e328357f5ad. AIDS. 2012. PMID: 22824628 Free PMC article.
-
Pharmacodynamics of long-acting folic acid-receptor targeted ritonavir-boosted atazanavir nanoformulations.Biomaterials. 2015 Feb;41:141-50. doi: 10.1016/j.biomaterials.2014.11.012. Epub 2014 Dec 9. Biomaterials. 2015. PMID: 25522973 Free PMC article.
-
Suppression of Active HIV-1 Infection in CD34+ Hematopoietic Humanized NSG Mice by a Combination of Combined Antiretroviral Therapy and CCR5 Targeting Drugs.AIDS Res Hum Retroviruses. 2019 Aug;35(8):718-728. doi: 10.1089/AID.2018.0305. Epub 2019 Jun 25. AIDS Res Hum Retroviruses. 2019. PMID: 31099257
-
Long-acting slow effective release antiretroviral therapy.Expert Opin Drug Deliv. 2017 Nov;14(11):1281-1291. doi: 10.1080/17425247.2017.1288212. Epub 2017 Feb 6. Expert Opin Drug Deliv. 2017. PMID: 28128004 Free PMC article. Review.
-
The Promise of Long-Acting Antiretroviral Therapies: From Need to Manufacture.Trends Microbiol. 2019 Jul;27(7):593-606. doi: 10.1016/j.tim.2019.02.009. Epub 2019 Apr 10. Trends Microbiol. 2019. PMID: 30981593 Free PMC article. Review.
Cited by
-
Long-acting parenteral nanoformulated antiretroviral therapy: interest and attitudes of HIV-infected patients.Nanomedicine (Lond). 2013 Nov;8(11):1807-13. doi: 10.2217/nnm.12.214. Epub 2013 Apr 23. Nanomedicine (Lond). 2013. PMID: 23611617 Free PMC article.
-
Overcoming pharmacologic sanctuaries.Curr Opin HIV AIDS. 2013 May;8(3):190-5. doi: 10.1097/COH.0b013e32835fc68a. Curr Opin HIV AIDS. 2013. PMID: 23454865 Free PMC article. Review.
-
Mannose-decorated hybrid nanoparticles for enhanced macrophage targeting.Biochem Biophys Rep. 2019 Jan 25;17:197-207. doi: 10.1016/j.bbrep.2019.01.007. eCollection 2019 Mar. Biochem Biophys Rep. 2019. PMID: 30723809 Free PMC article.
-
Cellular Responses and Tissue Depots for Nanoformulated Antiretroviral Therapy.PLoS One. 2015 Dec 30;10(12):e0145966. doi: 10.1371/journal.pone.0145966. eCollection 2015. PLoS One. 2015. PMID: 26716700 Free PMC article.
-
Role of MRP transporters in regulating antimicrobial drug inefficacy and oxidative stress-induced pathogenesis during HIV-1 and TB infections.Front Microbiol. 2015 Sep 17;6:948. doi: 10.3389/fmicb.2015.00948. eCollection 2015. Front Microbiol. 2015. PMID: 26441882 Free PMC article. Review.
References
-
- Broder MS, Chang EY, Bentley TG, Juday T, Uy J. Cost effectiveness of atazanavir-ritonavir versus lopinavir-ritonavir in treatment-naive human immunodeficiency virus-infected patients in the United States. J Med Econ. 2011;14:167–78. - PubMed
-
- Chesney MA, Ickovics J, Hecht FM, Sikipa G, Rabkin J. Adherence: a necessity for successful HIV combination therapy. AIDS. 1999;13(suppl A):S271–8. - PubMed
-
- Braithwaite RS, Shechter S, Roberts MS, et al. Explaining variability in the relationship between antiretroviral adherence and HIV mutation accumulation. J Antimicrob Chemother. 2006;58:1036–43. - PubMed
Publication types
MeSH terms
Substances
Grants and funding
- P01 NS043985/NS/NINDS NIH HHS/United States
- 1P01 DA028555/DA/NIDA NIH HHS/United States
- P01MH64570/MH/NIMH NIH HHS/United States
- P01 DA028555/DA/NIDA NIH HHS/United States
- P30 MH062261/MH/NIMH NIH HHS/United States
- P01 NS031492/NS/NINDS NIH HHS/United States
- P01 NS31492/NS/NINDS NIH HHS/United States
- 2R01 NS034239/NS/NINDS NIH HHS/United States
- P20RR 15635/RR/NCRR NIH HHS/United States
- P01 MH064570/MH/NIMH NIH HHS/United States
- P01 NS4398/NS/NINDS NIH HHS/United States
- R37 NS036126/NS/NINDS NIH HHS/United States
- R01 NS034239/NS/NINDS NIH HHS/United States
- P20 RR015635/RR/NCRR NIH HHS/United States
- 2R37 NS36126/NS/NINDS NIH HHS/United States
LinkOut - more resources
Full Text Sources
Medical
Research Materials
