Interpreting cancer genomes using systematic host network perturbations by tumour virus proteins
- PMID: 22810586
- PMCID: PMC3408847
- DOI: 10.1038/nature11288
Interpreting cancer genomes using systematic host network perturbations by tumour virus proteins
Abstract
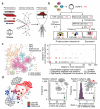
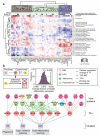
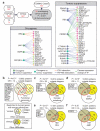
Genotypic differences greatly influence susceptibility and resistance to disease. Understanding genotype-phenotype relationships requires that phenotypes be viewed as manifestations of network properties, rather than simply as the result of individual genomic variations. Genome sequencing efforts have identified numerous germline mutations, and large numbers of somatic genomic alterations, associated with a predisposition to cancer. However, it remains difficult to distinguish background, or 'passenger', cancer mutations from causal, or 'driver', mutations in these data sets. Human viruses intrinsically depend on their host cell during the course of infection and can elicit pathological phenotypes similar to those arising from mutations. Here we test the hypothesis that genomic variations and tumour viruses may cause cancer through related mechanisms, by systematically examining host interactome and transcriptome network perturbations caused by DNA tumour virus proteins. The resulting integrated viral perturbation data reflects rewiring of the host cell networks, and highlights pathways, such as Notch signalling and apoptosis, that go awry in cancer. We show that systematic analyses of host targets of viral proteins can identify cancer genes with a success rate on a par with their identification through functional genomics and large-scale cataloguing of tumour mutations. Together, these complementary approaches increase the specificity of cancer gene identification. Combining systems-level studies of pathogen-encoded gene products with genomic approaches will facilitate the prioritization of cancer-causing driver genes to advance the understanding of the genetic basis of human cancer.
Figures


Comment in
-
Genomics: Viral vista.Nat Rev Cancer. 2012 Sep;12(9):582. doi: 10.1038/nrc3346. Epub 2012 Aug 9. Nat Rev Cancer. 2012. PMID: 22875018 No abstract available.
-
Cancer gene discovery goes viral.Nat Methods. 2012 Sep;9(9):868. doi: 10.1038/nmeth.2155. Nat Methods. 2012. PMID: 23097786 No abstract available.
Similar articles
-
[Are tumors caused by DNA viruses?].Pathol Microbiol (Basel). 1973;39(1):24-31. Pathol Microbiol (Basel). 1973. PMID: 4349815 German. No abstract available.
-
Viral perturbations of host networks reflect disease etiology.PLoS Comput Biol. 2012;8(6):e1002531. doi: 10.1371/journal.pcbi.1002531. Epub 2012 Jun 28. PLoS Comput Biol. 2012. PMID: 22761553 Free PMC article.
-
The landscape of viral expression and host gene fusion and adaptation in human cancer.Nat Commun. 2013;4:2513. doi: 10.1038/ncomms3513. Nat Commun. 2013. PMID: 24085110 Free PMC article.
-
Oncogenic Viral Protein Interactions with p53 Family Proteins.Klin Onkol. 2019 Fall;32(Supplementum 3):72-77. doi: 10.14735/amko20193S. Klin Onkol. 2019. PMID: 31627709 Review. English.
-
Epstein-Barr virus complementary strand transcripts (CSTs/BARTs) and cancer.Semin Cancer Biol. 2001 Dec;11(6):469-76. doi: 10.1006/scbi.2001.0414. Semin Cancer Biol. 2001. PMID: 11669609 Review.
Cited by
-
Recent strategies and progress in identifying host factors involved in virus replication.Curr Opin Microbiol. 2015 Aug;26:79-88. doi: 10.1016/j.mib.2015.06.001. Epub 2015 Jun 23. Curr Opin Microbiol. 2015. PMID: 26112615 Free PMC article. Review.
-
ATP synthase modulation leads to an increase of spare respiratory capacity in HPV associated cancers.Sci Rep. 2020 Oct 15;10(1):17339. doi: 10.1038/s41598-020-74311-6. Sci Rep. 2020. PMID: 33060693 Free PMC article.
-
ZER1 Contributes to the Carcinogenic Activity of High-Risk HPV E7 Proteins.mBio. 2022 Dec 20;13(6):e0203322. doi: 10.1128/mbio.02033-22. Epub 2022 Nov 8. mBio. 2022. PMID: 36346242 Free PMC article.
-
An in vitro mouse model of congenital cytomegalovirus-induced pathogenesis of the inner ear cochlea.Birth Defects Res A Clin Mol Teratol. 2013 Feb;97(2):69-78. doi: 10.1002/bdra.23105. Epub 2012 Dec 26. Birth Defects Res A Clin Mol Teratol. 2013. PMID: 23281115 Free PMC article.
-
Elucidating novel hepatitis C virus-host interactions using combined mass spectrometry and functional genomics approaches.Mol Cell Proteomics. 2014 Jan;13(1):184-203. doi: 10.1074/mcp.M113.030155. Epub 2013 Oct 29. Mol Cell Proteomics. 2014. PMID: 24169621 Free PMC article.
References
-
- Stratton MR. Exploring the genomes of cancer cells: progress and promise. Science. 2011;331:1553–1558. - PubMed
Publication types
MeSH terms
Substances
Associated data
- Actions
Grants and funding
- R01 CA131354/CA/NCI NIH HHS/United States
- R01 HG001715/HG/NHGRI NIH HHS/United States
- R01CA047006/CA/NCI NIH HHS/United States
- U01CA141583/CA/NCI NIH HHS/United States
- T32 HL007208/HL/NHLBI NIH HHS/United States
- R01CA085180/CA/NCI NIH HHS/United States
- R01 CA093804/CA/NCI NIH HHS/United States
- K25HG006031/HG/NHGRI NIH HHS/United States
- R01 CA085180/CA/NCI NIH HHS/United States
- K25 HG006031/HG/NHGRI NIH HHS/United States
- R01CA093804/CA/NCI NIH HHS/United States
- K08 HL098361/HL/NHLBI NIH HHS/United States
- U01 CA141583/CA/NCI NIH HHS/United States
- P50HG004233/HG/NHGRI NIH HHS/United States
- K08HL098361/HL/NHLBI NIH HHS/United States
- P01CA050661/CA/NCI NIH HHS/United States
- R01CA081135/CA/NCI NIH HHS/United States
- R01CA131354/CA/NCI NIH HHS/United States
- R01 CA081135/CA/NCI NIH HHS/United States
- R01 CA047006/CA/NCI NIH HHS/United States
- F32 GM095284/GM/NIGMS NIH HHS/United States
- P50 HG004233/HG/NHGRI NIH HHS/United States
- K08 CA122833/CA/NCI NIH HHS/United States
- R01HG001715/HG/NHGRI NIH HHS/United States
- R01CA066980/CA/NCI NIH HHS/United States
- T32HL007208/HL/NHLBI NIH HHS/United States
- R01CA063113/CA/NCI NIH HHS/United States
- P01 CA050661/CA/NCI NIH HHS/United States
- F32GM095284/GM/NIGMS NIH HHS/United States
- R01 CA063113/CA/NCI NIH HHS/United States
- R01 CA066980/CA/NCI NIH HHS/United States
LinkOut - more resources
Full Text Sources
Other Literature Sources
Molecular Biology Databases
Research Materials

