

Inhibition of protein geranylgeranylation and farnesylation protects against graft-versus-host disease via effects on CD4 effector T cells
- PMID: 22801964
- PMCID: PMC3533657
- DOI: 10.3324/haematol.2012.065789
Inhibition of protein geranylgeranylation and farnesylation protects against graft-versus-host disease via effects on CD4 effector T cells
Abstract
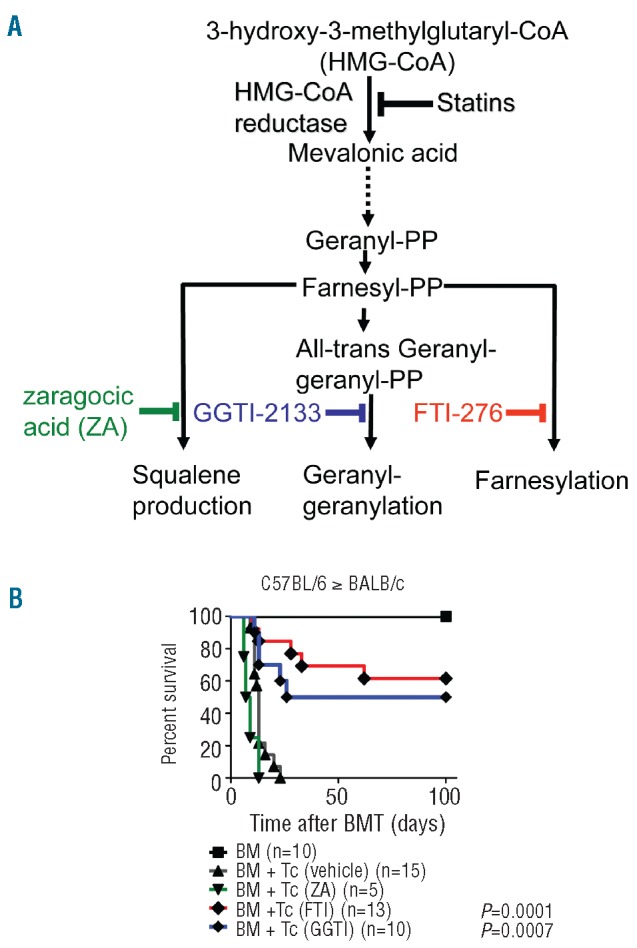
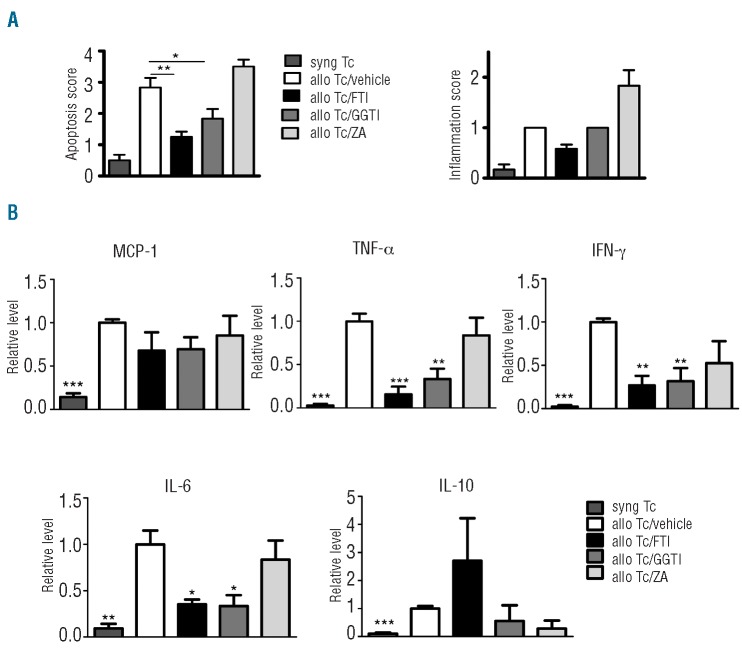
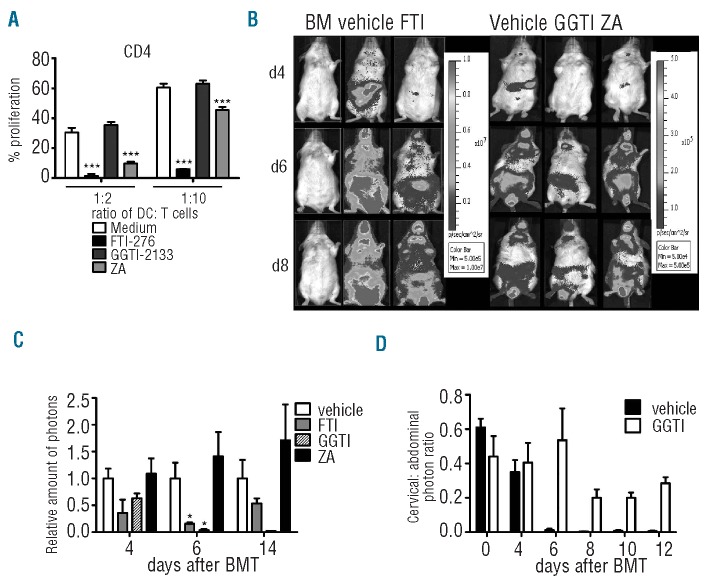
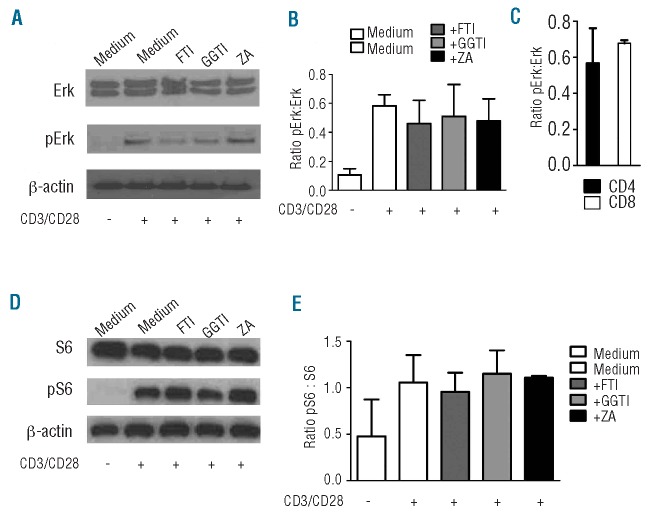
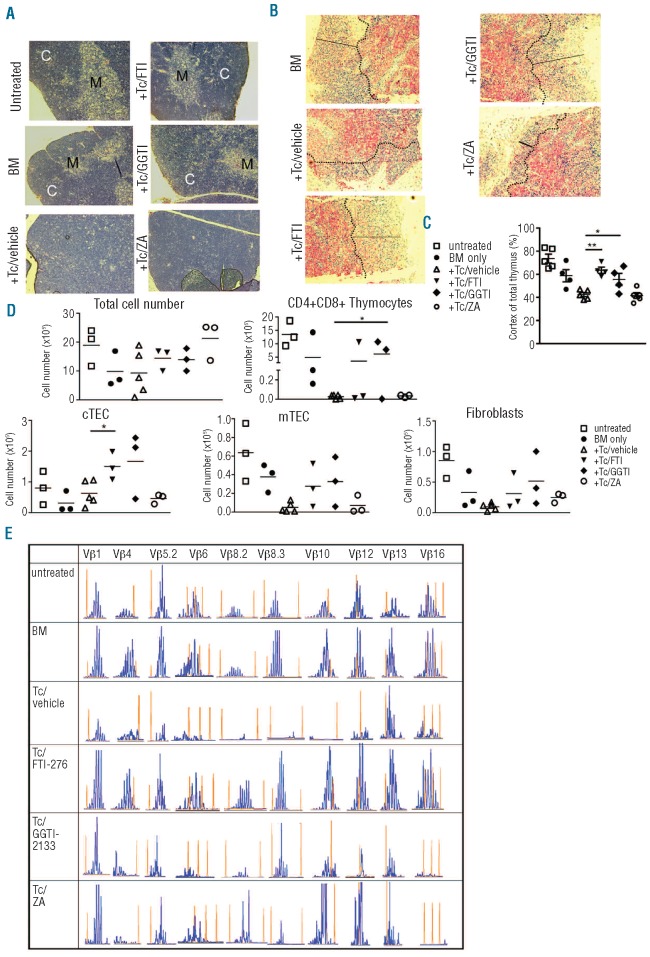
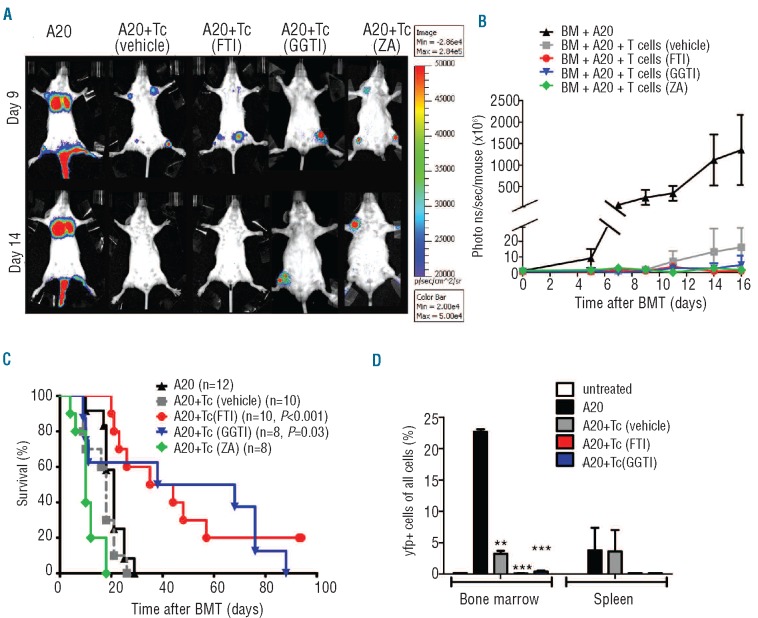
Despite advances in immunosuppressive regimens, acute graft-versus-host disease remains a frequent complication of allogeneic hematopoietic cell transplantation. Pathogenic donor T cells are dependent on correct attachment of small GTPases to the cell membrane, mediated by farnesyl- or geranylgeranyl residues, which, therefore, constitute potential targets for graft-versus-host disease prophylaxis. A mouse model was used to study the impact of a farnesyl-transferase inhibitor and a geranylgeranyl-transferase inhibitor on acute graft-versus-host disease, anti-cytomegalovirus T-cell responses and graft-versus-leukemia activity. Treatment of mice undergoing allogeneic hematopoietic cell transplantation with farnesyl-transferase inhibitor and geranylgeranyl-transferase inhibitor reduced the histological severity of graft-versus-host disease and prolonged survival significantly. Mechanistically, farnesyl-transferase inhibitor and geranylgeranyl-transferase inhibitor treatment resulted in reduced alloantigen-driven expansion of CD4 T cells. In vivo treatment led to increased thymic cellularity and polyclonality of the T-cell receptor repertoire by reducing thymic graft-versus-host disease. These effects were absent when squalene production was blocked. The farnesyl-transferase inhibitor and geranylgeranyl-transferase inhibitor did not compromise CD8 function against leukemia cells or reconstitution of T cells that were subsequently responsible for anti-murine cytomegalovirus responses. In summary, we observed an immunomodulatory effect of inhibitors of farnesyl-transferase and geranylgeranyl-transferase on graft-versus-host disease, with enhanced functional immune reconstitution. In the light of the modest toxicity of farnesyl-transferase inhibitors such as tipifarnib in patients and the potent reduction of graft-versus-host disease in mice, farnesyl-transferase and geranylgeranyl-transferase inhibitors could help to reduce graft-versus-host disease significantly without having a negative impact on immune reconstitution.
Figures
Comment in
-
Farnesyl and geranylgeranyl transferase inhibitors: an anti-inflammatory effect. Comment to "Inhibition of protein geranylgeranylation and farnesylation protects against graft-versus-host disease via effects on CD4 effector T cells" Haematologica. 2013;98(1):31-40.Haematologica. 2013 Apr;98(4):e44-5. doi: 10.3324/haematol.2012.082040. Haematologica. 2013. PMID: 23543155 Free PMC article. No abstract available.
Similar articles
-
Farnesyl and geranylgeranyl transferase inhibitors: an anti-inflammatory effect. Comment to "Inhibition of protein geranylgeranylation and farnesylation protects against graft-versus-host disease via effects on CD4 effector T cells" Haematologica. 2013;98(1):31-40.Haematologica. 2013 Apr;98(4):e44-5. doi: 10.3324/haematol.2012.082040. Haematologica. 2013. PMID: 23543155 Free PMC article. No abstract available.
-
Ligation of 4-1BB (CDw137) regulates graft-versus-host disease, graft-versus-leukemia, and graft rejection in allogeneic bone marrow transplant recipients.J Immunol. 2001 Mar 1;166(5):3174-83. doi: 10.4049/jimmunol.166.5.3174. J Immunol. 2001. PMID: 11207270
-
Flow cytometric analysis of the graft-versus-Leukemia-effect after hematopoietic stem cell transplantation in mice.Cytometry A. 2015 Apr;87(4):334-45. doi: 10.1002/cyto.a.22619. Epub 2015 Feb 24. Cytometry A. 2015. PMID: 25717029
-
Protein prenylation and synaptic plasticity: implications for Alzheimer's disease.Mol Neurobiol. 2014 Aug;50(1):177-85. doi: 10.1007/s12035-013-8627-z. Epub 2014 Jan 5. Mol Neurobiol. 2014. PMID: 24390573 Free PMC article. Review.
-
Indole derivatives, microbiome and graft versus host disease.Curr Opin Immunol. 2021 Jun;70:40-47. doi: 10.1016/j.coi.2021.02.006. Epub 2021 Feb 26. Curr Opin Immunol. 2021. PMID: 33647539 Free PMC article. Review.
Cited by
-
Farnesyltransferase-inhibitors exert in vitro immunosuppressive capacity by inhibiting human B-cells.Front Transplant. 2023 Nov 9;2:1233322. doi: 10.3389/frtra.2023.1233322. eCollection 2023. Front Transplant. 2023. PMID: 38993912 Free PMC article.
-
Rescue of DNA-PK Signaling and T-Cell Differentiation by Targeted Genome Editing in a prkdc Deficient iPSC Disease Model.PLoS Genet. 2015 May 22;11(5):e1005239. doi: 10.1371/journal.pgen.1005239. eCollection 2015 May. PLoS Genet. 2015. PMID: 26000857 Free PMC article.
-
The role of cholesterol metabolism in leukemia.Blood Sci. 2019 Sep 17;1(1):44-49. doi: 10.1097/BS9.0000000000000016. eCollection 2019 Aug. Blood Sci. 2019. PMID: 35402792 Free PMC article. Review.
-
Statins Directly Influence the Polarization of Adipose Tissue Macrophages: A Role in Chronic Inflammation.Biomedicines. 2021 Feb 19;9(2):211. doi: 10.3390/biomedicines9020211. Biomedicines. 2021. PMID: 33669779 Free PMC article.
-
Statins and clinical outcomes in hospitalized COVID-19 patients with and without Diabetes Mellitus: a retrospective cohort study with propensity score matching.Cardiovasc Diabetol. 2021 Jul 10;20(1):140. doi: 10.1186/s12933-021-01336-0. Cardiovasc Diabetol. 2021. PMID: 34246277 Free PMC article.
References
-
- Van Aelst L, D'Souza-Schorey C. Rho GTPases and signaling networks. Genes Dev. 1997;11(18):2295-322 - PubMed
-
- Zhang FL, Casey PJ. Protein prenylation: Molecular mechanisms and functional consequences. Annu Rev Biochem. 1996;65:241-69 - PubMed
-
- Na HJ, Lee SJ, Kang YC, Cho YL, Nam WD, Kim PK, et al. Inhibition of farnesyltransferase prevents collagen-induced arthritis by down-regulation of inflammatory gene expression through suppression of p21(ras)-dependent NF-kappaB activation. J Immunol. 2004;173(2):1276-83 - PubMed
-
- Sung ND, Cho YK, Kwon BM, Hyun KH, Kim CK. 3D QSAR studies on cinnamaldehyde analogues as farnesyl protein transferase inhibitors. Arch Pharm Res. 2004;27(10):1001-8 - PubMed
Publication types
MeSH terms
Substances
LinkOut - more resources
Full Text Sources
Research Materials
