. 2012 Aug 15;189(4):1843-9.
doi: 10.4049/jimmunol.1200584. Epub 2012 Jul 13.

NK cell response to vaccinia virus is regulated by myeloid-derived suppressor cells

Affiliations

NK cell response to vaccinia virus is regulated by myeloid-derived suppressor cells

Carl Fortin et al. J Immunol. .

Abstract

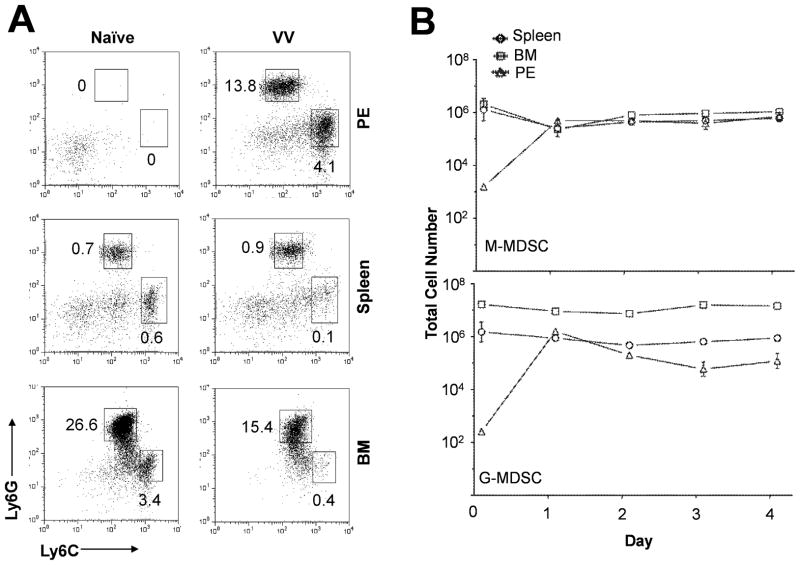
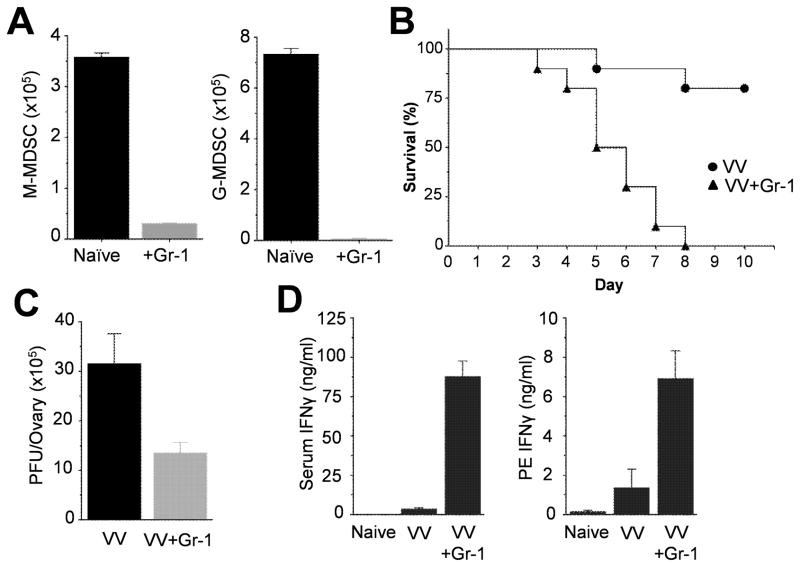
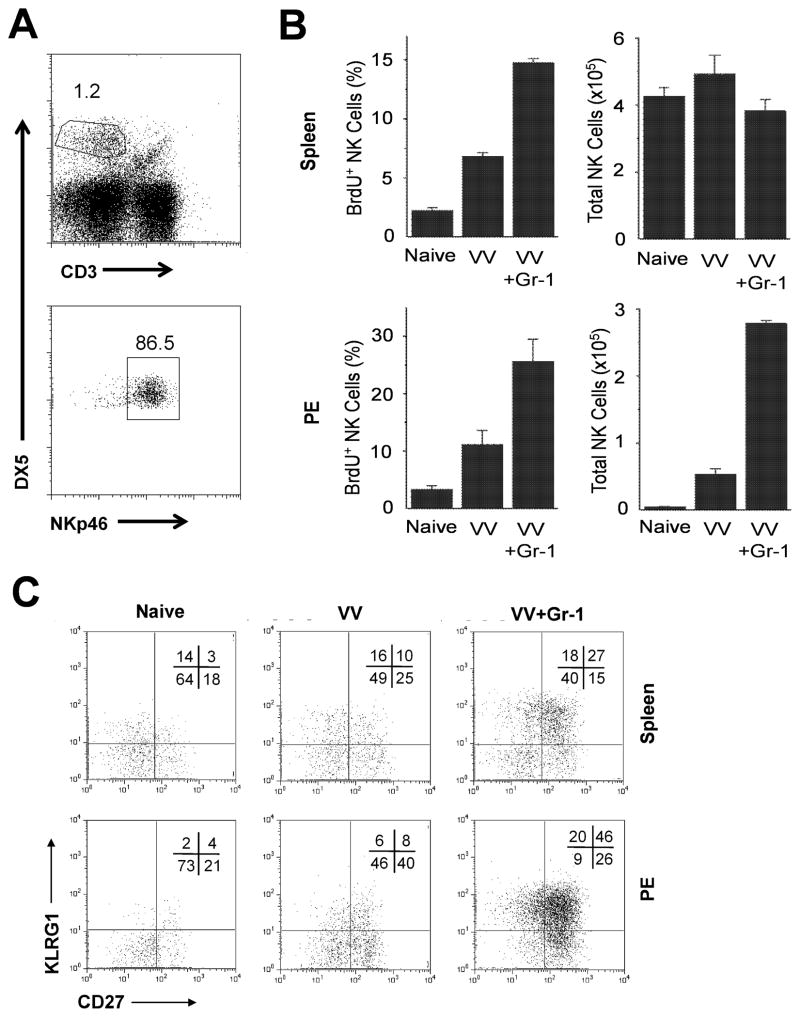
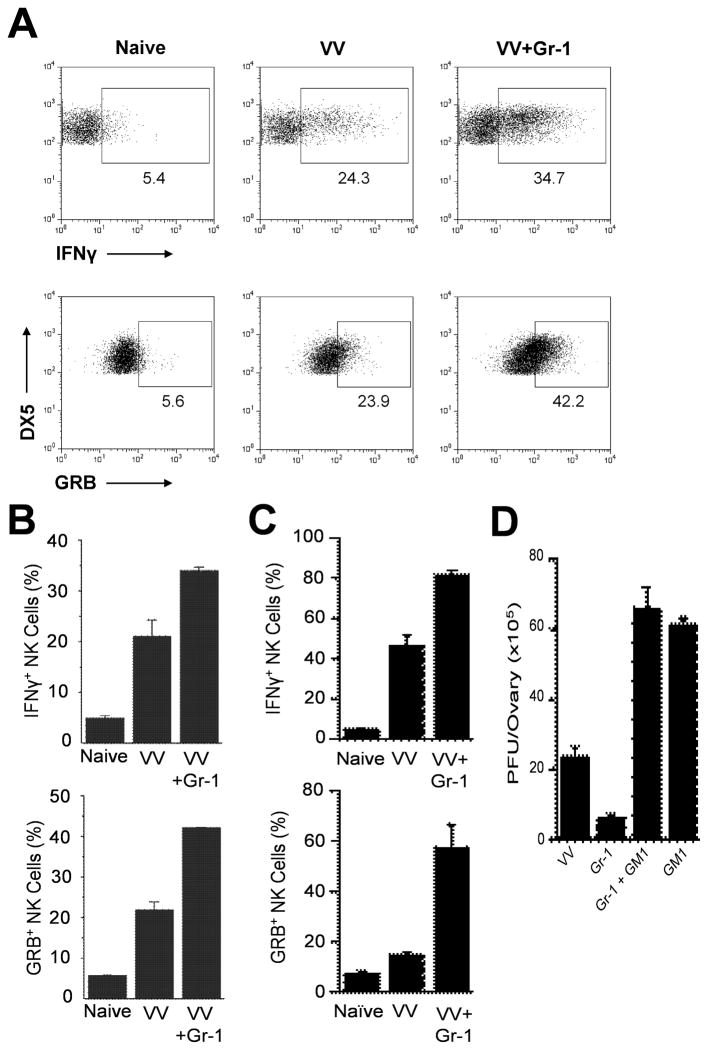
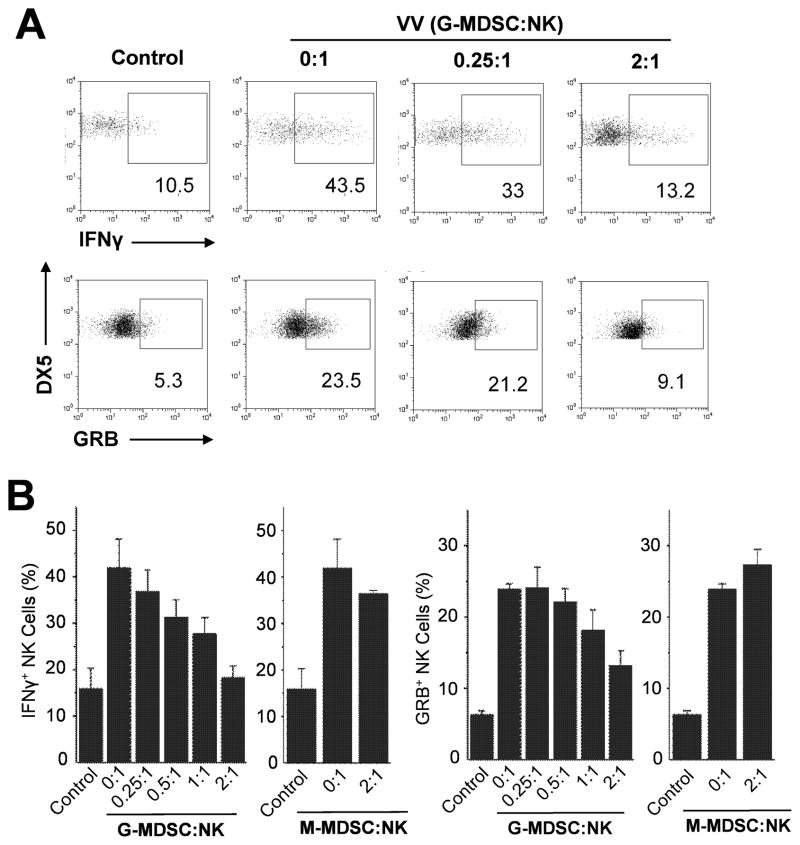
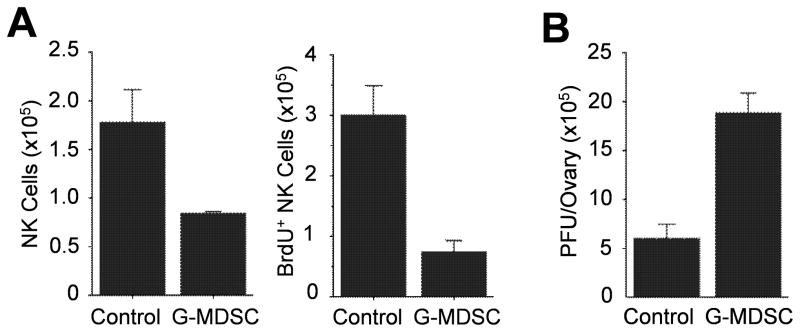
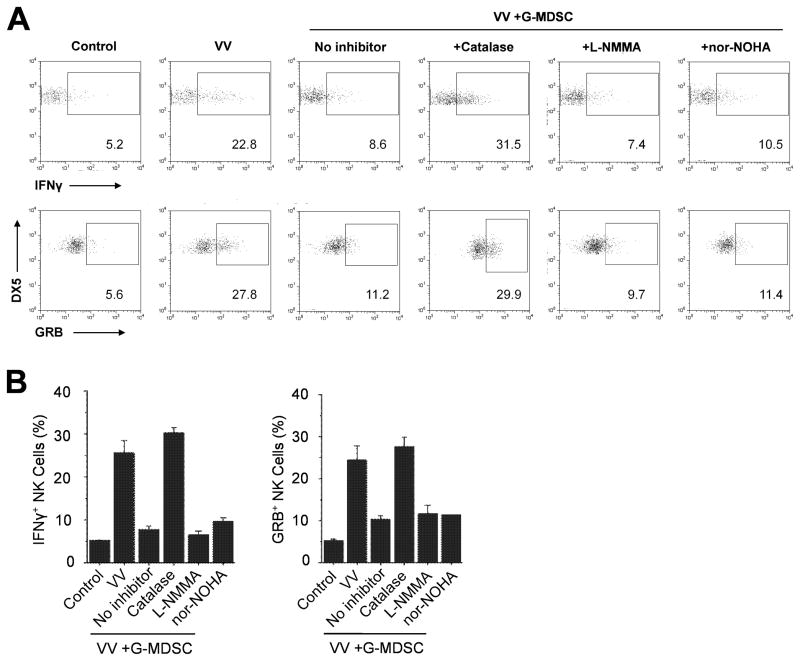
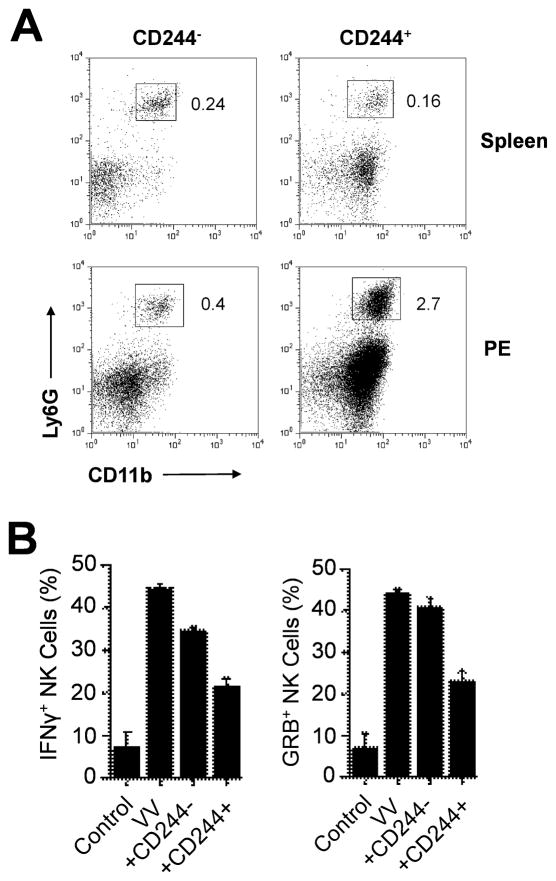
NK cells are critical for the innate immune control of poxviral infections. Previous studies have shown that NK cells are efficiently activated in response to infection with vaccinia virus (VV), the most studied member of the poxvirus family. However, it remains unknown whether the activation of NK cells in response to VV infection is tightly regulated. In this study, we showed that myeloid-derived suppressor cells (MDSCs) rapidly accumulated at the site of VV infection. In vivo depletion of MDSCs led to enhanced NK cell proliferation, activation, and function in response to VV infection. This was accompanied by an increase in mortality and systemic IFN-γ production. We further demonstrated that the granulocytic-MDSC (G-MDSC) subset was responsible for the suppression on NK cells and that this suppression was mediated by reactive oxygen species. These results indicate that G-MDSCs can negatively regulate NK cell activation and function in response to VV infection and suggest that manipulation of G-MDSCs could represent an attractive strategy for regulating NK cell activities for potential therapeutic benefits.


Figures

Figure 1
Figure 1
MDSCs accumulate rapidly at the site of VV infection. Mice were infected with 2 × 10⁶ pfu of VV intraperitoneally (VV) or left uninfected (Naïve). (A) 24 hr after infection, mice were sacrificed and cells from spleen, bone marrow (BM), and peritoneal exudate (PE) were stained with anti-CD11b, anti-Ly6G and anti-Ly6C. The events were gated on CD11b+ cells and the percentages of G-MDSCs (CD11b+Ly6G+Ly6Clow) and M-MDSCs (CD11b+ Ly6GLy6Chigh) among total cells were indicated. (B) At 0, 1, 2, 3, and 4 days after infection, the total cell numbers ± SD of G-MDSCs and M-MDSCs in spleen, BM and PE are shown (n=4 per group). Data shown is representative of two independent experiments.
Figure 2
Figure 2
Depletion of MDSCs results in increased mortality and IFNγ production in response to VV. (A) Naïve mice were treated with anti-Gr-1 Ab (+Gr-1) or left untreated (Naïve). 24 hr after treatment, mice were sacrificed and splenocytes were stained with anti-CD11b, anti-Ly6G and anti-Ly6C. The events were gated on CD11b+ cells and the total cell numbers of M-MDSCs and G-MDSCs are shown. (B) Mice were infected with 5 × 10⁶ pfu of VV intraperitoneally (VV) on day 0 and monitored for the survival over next 10 days. Some mice were also treated with anti-Gr-1 Ab (+Gr-1) on days -1, 2, 4 and 6. The Kaplan-Meier plot of the percentage of animal survival is shown (n=12 per group). (C-D) Mice were infected with 2 × 10⁶ pfu of VV intraperitoneally (VV) on day 0. Some mice were also treated with anti-Gr-1 Ab (+Gr-1) on days -1. (C) Ovaries from infected mice were harvested 36 hr later and assayed for viral load. Data represents viral titer ± SD as pfu per ovary (n=4 per group). (D) Serum and peritoneal cavity exudates (PE) were harvested 24 hr after infection and analyzed for IFNγ by ELISA. Data represents the mean ng/ml ± SD of IFNγ (n=4 per group). Data shown are representative of three independent experiments.
Figure 3
Figure 3
Depletion of MDSCs enhances NK cell proliferation and activation. (A) Spenocytes from naïve mouse were stained with anti-DX5, anti-CD3, and anti-NKp46. The left plot represents the percentage of DX5+CD3 cells among total splenoctyes. The right plot shows the percentage of NKp46+ cells among DX5+CD3 cells. (B-C) Mice were infected with 2 × 10⁶ pfu of VV intraperitoneally (VV) or left uninfected (Naïve). Some mice were depleted of MDSCs 24 hr before infection (VV+Gr-1). 36 hr after infection, splenocytes and peritoneal exudates (PE) were stained with anti-CD3 and anti-DX5 and assayed for total DX5+CD3 NK cell numbers, NK cell proliferation, as well as for KLRG1 and CD27 expression on NK cells. (B) The mean cell numbers ± SD of DX5+CD3 NK cells are shown (n=6 per group). In addition, NK cell proliferation is shown by the mean percentage ± SD of BrdU+ cells among DX5+CD3 NK cells (n=6 per group). (C) FACS plots of KLRG1 and CD27 expression on DX5+CD3 NK cells. Percentages of NK cells expressing KLRG1and/or CD27are provided for each quadrant. Data shown is representative of three independent experiments.
Figure 4
Figure 4
Depletion of MDSCs promotes NK Cell activation and function. (A-C) Mice were infected with VV or left uninfected (Naïve). Some mice were depleted of MDSCs 24 hr before infection (VV+Gr-1). 36 hr after infection, mice were sacrificed and splenocytes and peritoneal exudates were assayed for intracellular IFNγ and Granzyme B (GRB) production by DX5+CD3NK cells. (A) FACS plots of intracellular IFNγ and Granzyme B production by splenic NK cells are shown with the percentage of IFNγ or Granzyme B positive cells among DX5+CD3 NK cells indicated. (B) The mean percentage ± SD of IFNγ or Granzyme B positive cells among splenic DX5+CD3 NK cells is provided (n=6 per group). (C) The mean percentage ± SD of IFNγ or Granzyme B positive cells among peritoneal exudate DX5+CD3 NK cells is provided (n=6 per group). (D) Mice were depleted of MDSCs (Gr-1), of NK cells (GM1), or both (Gr-1 + GM1), and subsequently infected with 2 × 10⁶ pfu of VV. Some mice were left untreated before infection (VV). The ovaries were harvested 36 h after infection and assayed for viral load. Data represents viral titer ± SD as pfu per ovary (n=4 per group). Data shown is representative of three independent experiments.
Figure 5
Figure 5
G-MDSCs suppress NK cell activation in vitro. DX5+CD3 NK cells were cocultured with CD11c+ DCs and infected with VV (VV) or left uninfected (Control). In some wells, granulocytic MDSCs (G-MDSC) or monocytic MDSCs (M-MDSC) purified from spleens of infected mice were added to the coculture at the indicated MDSC:NK cell ratios. 24 hr after infection, DX5+CD3 NK cells were assayed for intracellular IFNγ and Granzyme B (GRB) production. (A) FACS plots show the percentage of IFNγ or Granzyme B positive cells among DX5+CD3 NK cells. (B) The mean percentages ± SD of IFNγ or Granzyme B positive cells among DX5+CD3 NK cells are provided. Data shown is representative of three independent experiments.
Figure 6
Figure 6
G-MDSCs suppress NK cell proliferation and function in vivo. Purified G-MDSCs (2 × 10⁷) were transferred intravenously into naïve mice, which were immediately infected with 2 × 10⁶ pfu of VV intraperitoneally (G-MDSC). Some mice did not receive G-MDSCs before infection with VV were used as the control group (Control). 36 h after infection, mice were sacrificed and peritoneal exudates were assayed for total NK cell numbers, NK cell proliferation, and viral load. (A) The mean numbers ± SD of total DX5+CD3 NK cells are shown (n=4 per group). NK cell proliferation is indicated by the mean number ± SD of BrdU+ NK cells among total DX5+CD3 NK cells (n=4 per group). (B) The ovaries were harvested and assayed for viral load. Data represents viral titer ± SD as pfu per ovary (n=4 per group). Data shown is representative of two independent experiments.
Figure 7
Figure 7
G-MDSC-mediated suppression of NK cells is mediated by ROS. DX5+CD3NK cells were cocultured with CD11c+ DCs and infected with VV (VV) or left uninfected (Control). In some wells, G-MDSCs purified from spleens of infected mice were added at a 2:1 G-MDSC:NK ratio (VV+G-MDSC). In addition, where indicated, 1000 U/ml Catalase, 0.5 mM L-NMMA, or 0.5 mM nor-NOHA were added to inhibit ROS, NO production, and arginase, respectively. 24 hr after infection, NK cells were assayed for intracellular IFNγ and Granzyme B (GRB). (A) FACS plots of intracellular IFNγ and Granzyme B production by NK cells are shown with the percentage of IFNγ or Granzyme B positive cells among DX5+CD3 NK cells indicated. (B) The mean percentage ± SEM of IFNγ or Granzyme B positive cells among DX5+CD3 NK cells is provided. Data shown is representative of three independent experiments.
Figure 8
Figure 8
The expression of CD244 characterizes NK cell-suppressive G-MDSCs. (A) Mice were infected with 2 × 10⁶ pfu of VV intraperitoneally. 24 h after infection, cells from spleen and peritoneal exudates (PE) were stained with anti-CD244, anti-CD11b, and anti-Ly6G. The events were gated according to CD244 expression and the percentage of CD244 and CD244+ CD11b+Ly6G+ cells among total cells are indicated. (B) DX5+CD3NK cells were cocultured with CD11c+ DCs and infected with VV or left uninfected (Control). In some wells, sorted CD244 (+CD244) or CD244+ (+CD244+) CD11b+Ly6G+ cells were added to the coculture at the CD11b+Ly6G+:NK cell ratio of 1:2. NK cells were assayed for intracellular IFNγ and Granzyme B production 24 hr later. FACS plots show the percentage of IFNγ or Granzyme B positive cells among DX5+CD3 NK cells. Data is representative of two independent experiments.

Similar articles

Cited by

References

    1. French AR, Yokoyama WM. Natural killer cells and viral infections. Curr Opin Immunol. 2003;15:45–51. - PubMed
    1. Lee SH, Miyagi T, Biron CA. Keeping NK cells in highly regulated antiviral warfare. Trends Immunol. 2007;28:252–259. - PubMed
    1. Biron CA, Byron KS, Sullivan JL. Severe herpesvirus infections in an adolescent without natural killer cells. N Engl J Med. 1989;320:1731–1735. - PubMed
    1. Bukowski JF, Woda BA, Habu S, Okumura K, Welsh RM. Natural killer cell depletion enhances virus synthesis and virus-induced hepatitis in vivo. J Immunol. 1983;131:1531–1538. - PubMed
    1. Natuk RJ, Welsh RM. Accumulation and chemotaxis of natural killer/large granular lymphocytes at sites of virus replication. J Immunol. 1987;138:877–883. - PubMed

Publication types