. 2012 Aug 16;120(7):1422-31.
doi: 10.1182/blood-2012-03-419747. Epub 2012 Jul 11.

Commitment to glycolysis sustains survival of NO-producing inflammatory dendritic cells

Affiliations

Commitment to glycolysis sustains survival of NO-producing inflammatory dendritic cells

Bart Everts et al. Blood. .

Abstract

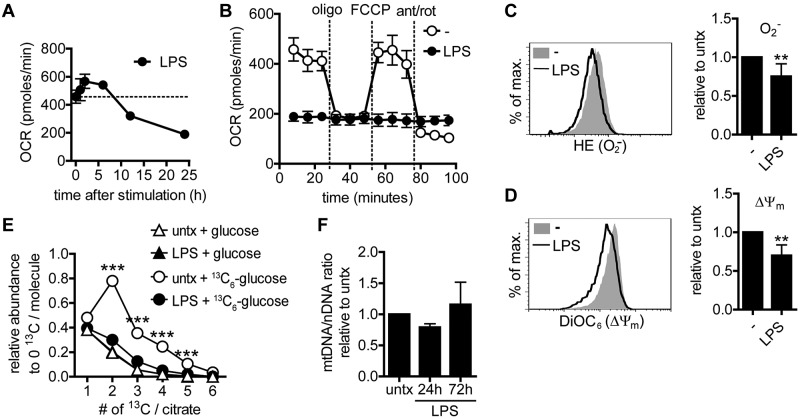
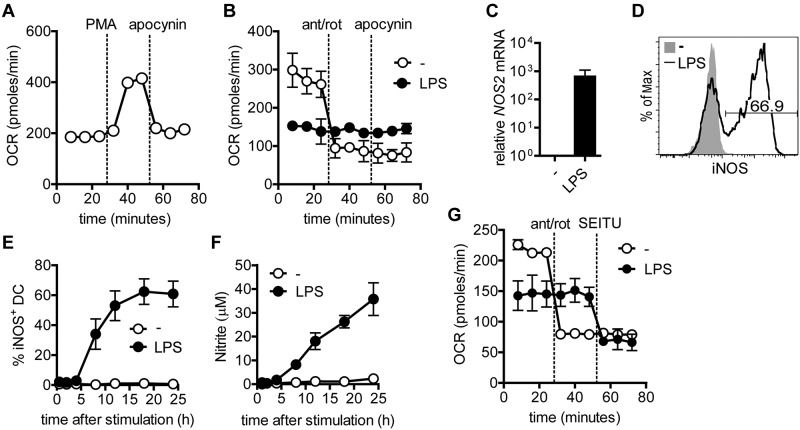
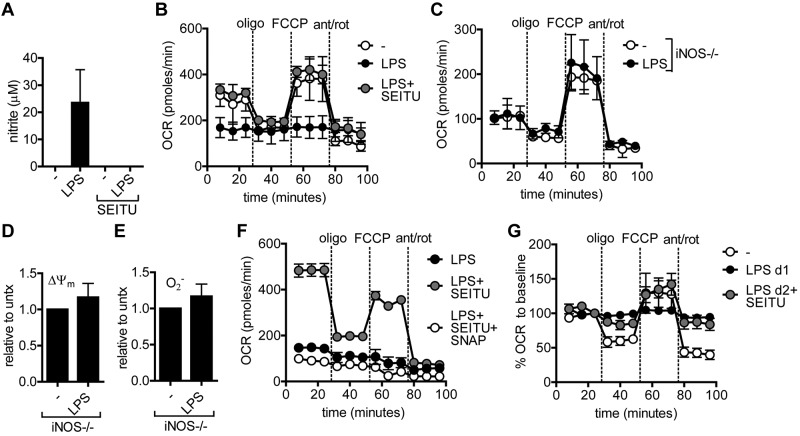
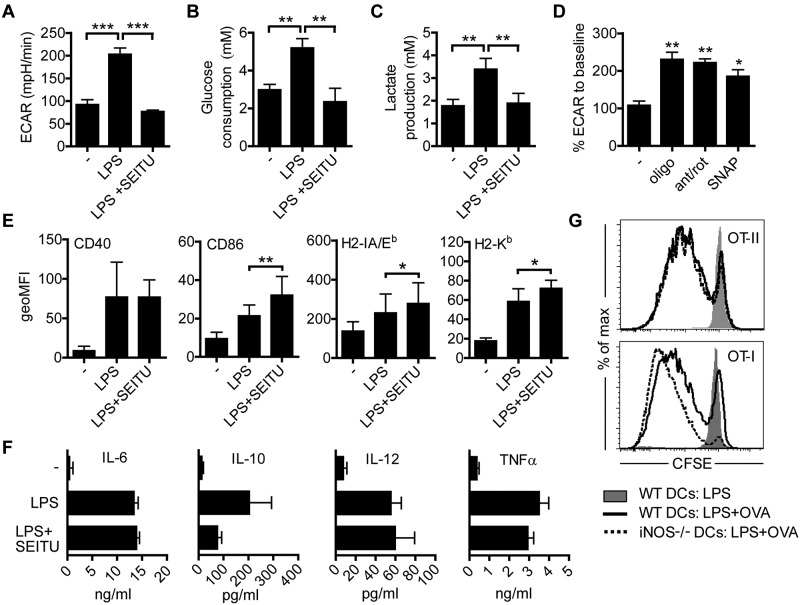
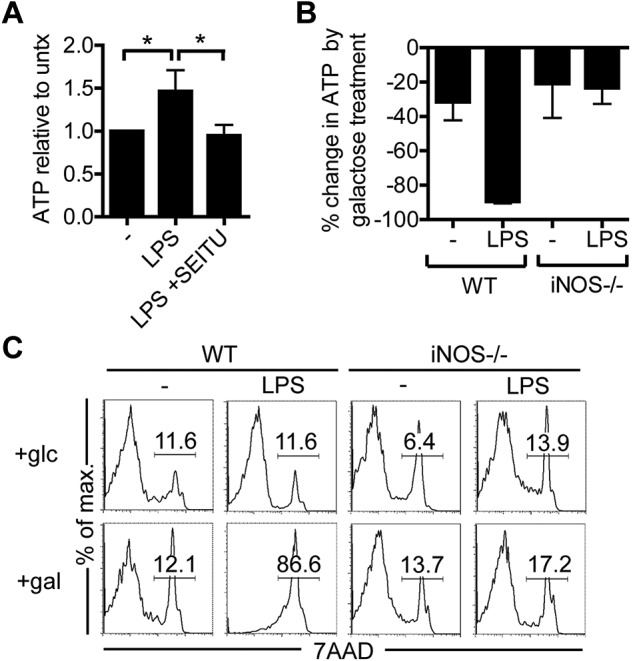
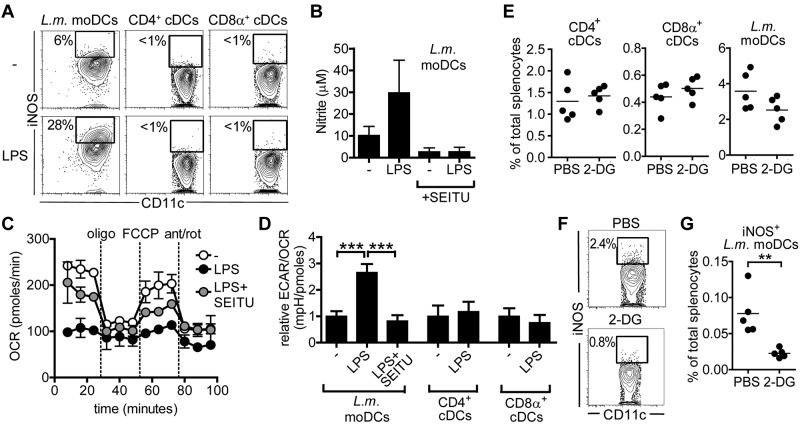
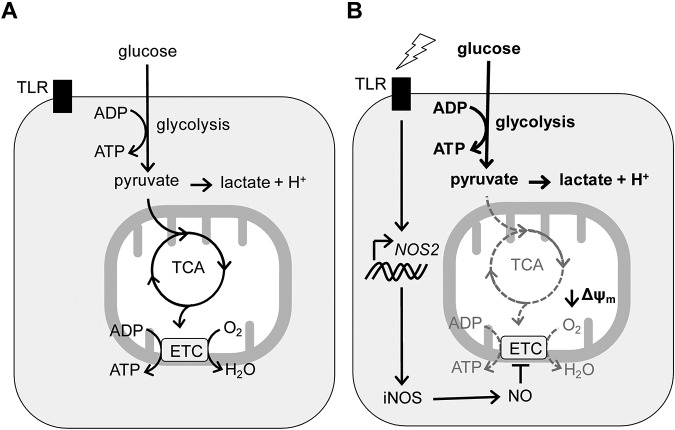
TLR agonists initiate a rapid activation program in dendritic cells (DCs) that requires support from metabolic and bioenergetic resources. We found previously that TLR signaling promotes aerobic glycolysis and a decline in oxidative phosphorylation (OXHPOS) and that glucose restriction prevents activation and leads to premature cell death. However, it remained unclear why the decrease in OXPHOS occurs under these circumstances. Using real-time metabolic flux analysis, in the present study, we show that mitochondrial activity is lost progressively after activation by TLR agonists in inflammatory blood monocyte-derived DCs that express inducible NO synthase. We found that this is because of inhibition of OXPHOS by NO and that the switch to glycolysis is a survival response that serves to maintain ATP levels when OXPHOS is inhibited. Our data identify NO as a profound metabolic regulator in inflammatory monocyte-derived DCs.


Figures

Figure 1
Figure 1
Changes in mitochondrial function in DCs after TLR activation. (A) BM-derived DCs were seeded in a Seahorse XF-24 analyzer, stimulated with LPS, and at the indicated time points OCR was determined. Dashed line represents baseline OCR. Data represent means ± SD of triplicates. One representative experiment of 3 is shown. (B) DCs were seeded in a Seahorse XF-24 analyzer, stimulated with medium as a control or LPS for 24 hours, and real-time OCR was determined during sequential treatments with oligomycin (ATP-synthase inhibitor), FCCP, and antimycin-A/rotenone (ETC inhibitors). Data represent means ± SD of triplicates. One of 6 experiments is shown. (C-D) Twenty-four-hour LPS-stimulated DCs were stained with hydroethidin (HE) to detect O2 production or DiOC6 to determine mitochondrial membrane potential (ΔΨm). A representative histogram is shown and the bar graph represents means ± SD of 3 independent experiments. **P < .01. (E) Twenty-one hours after stimulation with LPS or medium, DCs were fed 13C6-glucose or normal 12C-glucose (both 10mM) for 3 hours. Next, metabolites were isolated from cells by methanol extraction and the 13C content in citrate was quantified by mass spectrometry. Amounts of citrate carrying 1-6 13C are shown relative to levels of citrate harboring no 13C (only 12C). Relative amounts of naturally occurring 13C in citrate when DCs are pulsed with unlabeled glucose are shown in triangles. Data represent means ± SD of triplicates. ***P < .001 compared with naturally occurring 13C in citrate. Data represent means ± SD of triplicates of 1 experiment. (F) mtDNA/nDNA ratio at different time points after LPS stimulation. Data represent means ± SD of 2 independent experiments. ant/rot indicates antimycin-A/rotenone; and oligo, oligomycin.
Figure 2
Figure 2
Activation of DCs by LPS drives iNOS expression and NO production. (A) Presence of functional NADPH oxidase in DCs was tested by determining OCR in a Seahorse XF-24 analyzer in response to phorbol 12-myristate 13-acetate to activate the complex, and subsequently to specific NADPH oxidase inhibitor apocynin to block the complex. (B) DCs were seeded in a Seahorse XF-24 analyzer, stimulated with LPS or medium for 24 hours, and OCR was determined during sequential treatments with antimycin-A/rotenone (ETC inhibitors) and apocynin. Data represent means ± SD of triplicates. One of 2 experiments is shown. (C) Relative NOS2 mRNA expression was determined in DCs 8 hours after medium or LPS stimulation. Data represent means ± SD of 3 independent experiments. (D) Intracellular iNOS expression in 24-hour LPS-activated (black line) and unstimulated (gray histogram) DCs was determined by FACS. One experiment of 6 is shown. (E) iNOS expression was determined as in panel D at the indicated time points after LPS stimulation. Data represent means ± SD 2 independent experiments. (F) Nitrite levels were determined in culture supernatants at the indicated time points after LPS stimulation. Data represent means ± SD of 2 independent experiments. (G) DCs were seeded in a Seahorse XF-24 analyzer, stimulated with LPS or medium for 24 hours, and real-time OCR was determined during sequential treatments with antimycin-A/rotenone (ETC inhibitors) and the NOS inhibitor SEITU. Data represent means ± SD of triplicates. One of 3 experiments is shown.
Figure 3
Figure 3
iNOS-derived NO blocks mitochondrial respiration in LPS-stimulated DCs. (A) Nitrite levels were determined in culture supernatants of DCs stimulated with medium or LPS for 24 hours in the presence or absence of specific NOS inhibitor SEITU. Data represent means ± SD of 3 experiments. (B) DCs were seeded in a Seahorse XF-24 analyzer, stimulated with medium or LPS for 24 hours in the presence or absence of SEITU, and real-time basal OCR was determined as well as in response to sequential treatments with oligomycin, FCCP, and antimycin-A/rotenone. Data represent means ± SD of triplicates. One of 3 experiments is shown. (C) iNOS−/− DCs were stimulated with medium or LPS for 24 hours and analyzed as in panel B. Data represent means ± SD of triplicates. One of 3 experiments is shown. (D-E) Twenty-four-hour LPS-stimulated DCs were stained with hydroethidin to detect O2 production or DiOC6 to determine mitochondrial membrane potential (Ψm). Bars represent geoMFI ± SD of 3 experiments and data are plotted relative to unstimulated cells. (F) DCs were stimulated for 24 hours with LPS in the presence or absence of SEITU and the NO donor SNAP as indicated, and analyzed as in panel B. Data represent means ± SD of triplicates. One of 2 experiments is shown. (G) DCs were stimulated with medium, LPS for 24 hours, or LPS for 48 hours, with the last 24 hours in the presence of SEITU, and analyzed as in panel B. Data represent means ± SD of triplicates and are shown as percentage of OCR before drug treatment. One of 2 experiments is shown. ant/rot indicates antimycin-A/rotenone; and oligo, oligomycin.
Figure 4
Figure 4
LPS-activated DCs commit to glycolysis in response to NO-induced inhibition of mitochondrial respiration, but do not require sustained glycolysis for normal activation. (A) DCs were seeded in a Seahorse XF-24 Analyzer and either left unstimulated or treated with LPS for 24 hours in the presence or absence of SEITU, after which real-time rates of ECAR as a readout for lactate production were determined. Data represent means ± SD of 4 independent experiments. (B-C) DCs were treated as in panel A and supernatants collected 24 hours later were used to determine glucose consumption (B) and lactate production (C). Data represent means ± SD of 4 independent experiments. (D) DCs were seeded in a Seahorse XF-24 Analyzer and either left unstimulated or treated with the indicated reagents for 10 minutes, after which real-time rates of ECAR as a readout for lactate production were determined. Data represent means ± SD of 3 independent experiments. (E-F) DCs were stimulated with LPS for 24 hours in the presence or absence of the NOS inhibitor SEITU after which surface expression of indicated markers was analyzed by FACS (E) or cytokine levels (F) were determined in supernatants. Data represent means ± SD of 4 experiments. (G) Wild-type or iNOS−/− DCs were treated for 6 hours with the indicated reagents and subsequently cultured for 4 days in a 1:10 ratio with CFSE-labeled naive OT-II or OT-I T cells. One of 3 experiments is shown. *P < .05; **P < .01; ***P < .001. ant/rot indicates antimycin-A/rotenone; and oligo, oligomycin.
Figure 5
Figure 5
Commitment to glycolytic metabolism in LPS-activated DCs provides essential ATP for survival in the absence of mitochondrial respiration. (A) DCs were treated as indicated and 24 hours later cells were lysed and the relative ATP levels were measured. ATP data were normalized to ATP levels in unstimulated DCs. Data represent means ± SD of 4 independent experiments. (B) DCs were stimulated as indicated and 24 hours later, cells were cultured in medium in which glucose was replaced by galactose. After 15 minutes, cells were lysed and analyzed for ATP levels. ATP levels in DCs cultured in galactose-containing medium are shown as the percentage relative to DCs cultured in the presence of glucose. The percentage reduction in ATP levels represents ATP derived from glycolysis. Data represent means ± SD of duplicates of 1 of 2 independent experiments. (C) DCs were stimulated as in panel B for 24 hours and analyzed for cell death by 7-amino-actinomycin D staining after being cultured for an additional 24 hours in galactose- or glucose-containing medium. Data represent one of 2 independent experiments. *P < .05.
Figure 6
Figure 6
Ex vivo LPS-activated inflammatory moDCs display an iNOS-dependent block in mitochondrial respiration and depend on glycolysis for survival in vivo. Inflammatory splenic moDCs were isolated from mice infected for 2 days with L monocytogenes (strain ΔActA, 2 × 10⁵ CFU, intravenous) by sorting by flow cytometry for CD11c+CD11bintMHCII+Ly6Chi cells. Two subsets of resident splenic DCs were sorted from naive spleens based on expression of CD11chiMHCIIhiCD11b+CD4+ and CD11chiMHCIIhiDEC205+CD8α+. (A) Splenic DC subsets were left unstimulated or stimulated ex vivo with LPS for 24 hours and subsequently analyzed for intracellular iNOS expression. iNOS−/− cells were used to draw gates on iNOS+ cells. Representative FACS plots of 1 of 3 experiments are shown. (B) Supernatants from cultures of 24 hours ex vivo–stimulated inflammatory DCs were analyzed for nitrite levels. Data represent means ± SD of 3 experiments. (C) Ex vivo inflammatory moDCs were seeded in a Seahorse XF-24 analyzer, stimulated with medium or LPS for 24 hours in the presence or absence of SEITU, and real-time OCR was measured in response to sequential treatments with oligomycin, FCCP, and antimycin A/rotenone. Data represent means ± SD of triplicates. One of 2 experiments is shown. (D) Splenic DC subsets were cultured and stimulated as in panel C and the ratio between basal ECAR and OCR was calculated and plotted relative to the ratio of unstimulated DCs, which was set to 1. Data represent means ± SD of triplicates. One of 2 experiments is shown. (E) Mice infected for 1 day with L monocytogenes (strain ΔActA, 2 × 10⁵ CFU, intravenous) were injected intraperitoneally with PBS or 2-DG (4 g/kg), and 6 hours later DC frequencies were determined in spleens. Data are representative of 5 individual mice per group. One of 2 independent experiments is shown. (F) Percentage of inflammatory moDCs staining positive for iNOS after PBS or 2-DG treatment as described in panel E. (G) Frequency of iNOS+ inflammatory moDCs in spleens after PBS or 2-DG treatment as described in panel E. Data are representative of 5 individual mice per group. One of 2 independent experiments is shown. **P < .01; ***P < .001.
Figure 7
Figure 7
Schematic representation of iNOS-induced metabolic changes in DCs after TLR ligation. Unstimulated DCs can use both glycolysis and mitochondria for their bioenergetic and metabolic needs; however, TLR ligation induces iNOS expression and NO production that in an autocrine fashion inhibits the ETC and mitochondrial function. As a consequence, TLR-activated DCs enhance their glycolytic rate to prevent bioenergetic collapse and cell death.

Similar articles

Cited by

References

    1. Kapsenberg ML. Dendritic-cell control of pathogen-driven T-cell polarization. Nat Rev Immunol. 2003;3(12):984–993. - PubMed
    1. Joffre O, Nolte MA, Sporri R, Reis e Sousa C. Inflammatory signals in dendritic cell activation and the induction of adaptive immunity. Immunol Rev. 2009;227(1):234–247. - PubMed
    1. Amati L, Pepe M, Passeri ME, Mastronardi ML, Jirillo E, Covelli V. Toll-like receptor signaling mechanisms involved in dendritic cell activation: potential therapeutic control of T cell polarization. Curr Pharm Des. 2006;12(32):4247–4254. - PubMed
    1. Krawczyk CM, Holowka T, Sun J, et al. Toll-like receptor-induced changes in glycolytic metabolism regulate dendritic cell activation. Blood. 2010;115(23):4742–4749. - PMC - PubMed
    1. Warburg O. On the origin of cancer cells. Science. 1956;123(3191):309–314. - PubMed

Publication types

MeSH terms