Sex differences in the response to viral infections: TLR8 and TLR9 ligand stimulation induce higher IL10 production in males
- PMID: 22768144
- PMCID: PMC3387221
- DOI: 10.1371/journal.pone.0039853
Sex differences in the response to viral infections: TLR8 and TLR9 ligand stimulation induce higher IL10 production in males
Abstract
Background: Susceptibility to viral infections as well as their severity are higher in men than in women. Heightened antiviral responses typical of women are effective for rapid virus clearance, but if excessively high or prolonged, can result in chronic/inflammatory pathologies. We investigated whether this variability could be in part attributable to differences in the response to the Toll-Like Receptors (TLR) more involved in the virus recognition.
Methods: Cytokine production by peripheral blood mononuclear cells (PBMCs) from male and female healthy donors after stimulation with Toll-like receptors (TLR) 3, 7, 8, 9 ligands or with viruses (influenza and Herpes-simplex-1) was evaluated.
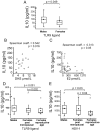
Results: Compared to females, PBMCs from males produced not only lower amounts of IFN-α in response to TLR7 ligands but also higher amounts of the immunosuppressive cytokine IL10 after stimulation with TLR8 and TLR9 ligands or viruses. IL10 production after TLR9 ligands or HSV-1 stimulation was significantly related with plasma levels of sex hormones in both groups, whereas no correlation was found in cytokines produced following TLR7 and TLR8 stimulation.
Conclusions: Given the role of an early production of IL10 by cells of innate immunity in modulating innate and adaptive immune response to viruses, we suggest that sex-related difference in its production following viral nucleic acid stimulation of TLRs may be involved in the sex-related variability in response to viral infections.
Conflict of interest statement
Figures


Similar articles
-
The dysfunctional innate immune response triggered by Toll-like receptor activation is restored by TLR7/TLR8 and TLR9 ligands in cutaneous lichen planus.Br J Dermatol. 2015 Jan;172(1):48-55. doi: 10.1111/bjd.13214. Epub 2014 Nov 20. Br J Dermatol. 2015. PMID: 24976336
-
Toll-like receptor 7 and 9 defects in common variable immunodeficiency.J Allergy Clin Immunol. 2009 Aug;124(2):349-56, 356.e1-3. doi: 10.1016/j.jaci.2009.05.019. Epub 2009 Jul 9. J Allergy Clin Immunol. 2009. PMID: 19592080 Free PMC article.
-
Innate immunity at the mucosal surface: role of toll-like receptor 3 and toll-like receptor 9 in cervical epithelial cell responses to microbial pathogens.Biol Reprod. 2006 May;74(5):824-31. doi: 10.1095/biolreprod.105.048629. Epub 2006 Jan 18. Biol Reprod. 2006. PMID: 16421230
-
Human Toll-like receptor-dependent induction of interferons in protective immunity to viruses.Immunol Rev. 2007 Dec;220(1):225-36. doi: 10.1111/j.1600-065X.2007.00564.x. Immunol Rev. 2007. PMID: 17979850 Free PMC article. Review.
-
Antiviral signaling through pattern recognition receptors.J Biochem. 2007 Feb;141(2):137-45. doi: 10.1093/jb/mvm032. Epub 2006 Dec 26. J Biochem. 2007. PMID: 17190786 Review.
Cited by
-
The anti-tumor effects of cetuximab in combination with VTX-2337 are T cell dependent.Sci Rep. 2021 Jan 15;11(1):1535. doi: 10.1038/s41598-020-80957-z. Sci Rep. 2021. PMID: 33452311 Free PMC article.
-
Twenty-First Century Viral Pandemics: A Literature Review of Sexual Transmission and Fertility Implications in Men.Sex Med Rev. 2020 Oct;8(4):518-530. doi: 10.1016/j.sxmr.2020.06.003. Epub 2020 Jul 24. Sex Med Rev. 2020. PMID: 32713674 Free PMC article. Review.
-
Inflammatory Response Genes' Polymorphism Associated with Risk of Rheumatic Heart Disease.J Pers Med. 2024 Jul 15;14(7):753. doi: 10.3390/jpm14070753. J Pers Med. 2024. PMID: 39064007 Free PMC article.
-
Sex Difference Leads to Differential Gene Expression Patterns and Therapeutic Efficacy in Mucopolysaccharidosis IVA Murine Model Receiving AAV8 Gene Therapy.Int J Mol Sci. 2022 Oct 21;23(20):12693. doi: 10.3390/ijms232012693. Int J Mol Sci. 2022. PMID: 36293546 Free PMC article.
-
Sex and molecular differences in cardiovascular parameters at peak influenza disease in mice.Physiol Genomics. 2023 Feb 1;55(2):79-89. doi: 10.1152/physiolgenomics.00146.2022. Epub 2023 Jan 16. Physiol Genomics. 2023. PMID: 36645670 Free PMC article.
References
-
- Barton GM. Viral recognition by Toll-like receptors. Semin Immunol. 2007;19:33–40. - PubMed
-
- Kawai T, Akira S. Toll-like Receptor and RIG-1-like Receptor Signaling. Proc Natl Acad Sci U S A. 2008;1143:1–20. - PubMed
-
- Chang ZL. Important aspects of Toll-like receptors, ligands and their signaling pathways. Inflamm Res. 2010;59:791–808. - PubMed
-
- McGuirk P, McCann C, Mills KHG. Pathogen-specific T regulatory 1 cells induced in the respiratory tract by a bacterial molecule that stimulates interleukin 10 production by dendritic cells: A novel strategy for evasion of protective T helper type 1 responses by Bordetella pertussis. J Exp Med. 2002;195:221–31. - PMC - PubMed
Publication types
MeSH terms
Substances
LinkOut - more resources
Full Text Sources
Medical
Miscellaneous

