. 2012 Sep;86(18):9817-27.
doi: 10.1128/JVI.00581-12. Epub 2012 Jul 3.

Histone H3 lysine 4 methylation marks postreplicative human cytomegalovirus chromatin

Affiliations

Histone H3 lysine 4 methylation marks postreplicative human cytomegalovirus chromatin

Alexandra Nitzsche et al. J Virol. 2012 Sep.

Abstract

In the nuclei of permissive cells, human cytomegalovirus genomes form nucleosomal structures initially resembling heterochromatin but gradually switching to a euchromatin-like state. This switch is characterized by a decrease in histone H3 K9 methylation and a marked increase in H3 tail acetylation and H3 K4 methylation across the viral genome. We used ganciclovir and a mutant virus encoding a reversibly destabilized DNA polymerase to examine the impact of DNA replication on histone modification dynamics at the viral chromatin. The changes in H3 tail acetylation and H3 K9 methylation proceeded in a DNA replication-independent fashion. In contrast, the increase in H3 K4 methylation proved to depend widely on viral DNA synthesis. Consistently, labeling of nascent DNA using "click chemistry" revealed preferential incorporation of methylated H3 K4 into viral (but not cellular) chromatin during or following DNA replication. This study demonstrates largely selective epigenetic tagging of postreplicative human cytomegalovirus chromatin.


Figures
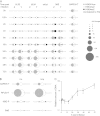
Fig 1
Fig 1
Temporal dynamics of histone H3 tail modifications during hCMV infection. Growth-arrested MRC-5 cells were infected with the hCMV Towne strain at a multiplicity of 5 PFU/cell for 0.5 to 72 h or were left uninfected (0 h). (A and B) Cells were subjected to ChIP using rabbit polyclonal antibodies directed against the H3 core domain, H3K9/14ac, H3K9me2, or H3K4me2. Normal rabbit IgG was used to control for nonspecific precipitation. Quantitative real-time PCR was performed on input and output (coprecipitated) DNA with primers complementary to the indicated viral or cellular genomic regions, and output-to-input ratios were calculated. Ratios from normal rabbit IgG ChIPs were subtracted from corresponding ratios obtained from total H3 and modified H3 reactions. Ratios from modified H3 ChIPs were normalized to corresponding ratios obtained from total-H3 reactions. Circle areas represent mean values, derived from two to four replicates, of IgG-subtracted and H3-normalized output-to-input DNA ratios for the indicated H3 modifications at each time point and for each sequence tested. To the right of panel A, a scale identifying fold differences relative to circle areas is shown. The same set of data and the corresponding total-H3 ratios are shown as bars with standard deviations in Fig. S1 in the supplemental material. (C) DNA was quantified by real-time PCR, and mean viral DNA values (determined at UL32-T) normalized to corresponding mean cellular DNA values (determined at GAPDH-T) derived from three biological and two technical replicates are presented with standard deviations.
Fig 2
Fig 2
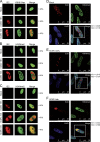
Intracellular localization of modified histone H3 forms relative to hCMV replication compartments and nascent DNA. MRC-5 cells were either mock infected or infected with the hCMV Towne strain and were fixed with methanol or paraformaldehyde. (A to C) Costaining was conducted using an hCMV IE2-specific mouse monoclonal antibody and rabbit polyclonal antibodies directed against H3K9/14ac, H3K9me2, or H3K4me2. Alexa Fluor 594- or Alexa Fluor 488-coupled goat antibodies directed against mouse or rabbit IgGs, respectively, were used as secondary conjugates. Representative nuclei showing the distribution of modified histones in mock-infected cells or relative to early (16 h postinfection) and late (72 h postinfection) viral replication compartments in cells infected with hCMV (5 PFU/cell) are presented as single-color and merged images. Percentages refer to the approximate fraction of nuclei exhibiting the respective pattern and are each based on inspection of at least 100 randomly selected nuclei. Magnification, ∼×500. (D to F) Newly synthesized DNA, H3K4me2, and total DNA were costained using EdU-based “click chemistry,” appropriate antibodies (rabbit polyclonal antibodies directed against H3K4me2 and Alexa Fluor 488-coupled goat antibodies directed against rabbit IgGs), and DAPI, respectively. Representative nuclei showing the distribution of H3K4me2 relative to nascent cellular (D) and viral (E and F) DNA are presented as single-color and merged images. (E and F) Early and late viral replication compartments, respectively, in cells asynchronously infected with hCMV (0.01 PFU/cell; 4 days postinfection). Within the framed areas, the extent of overlap between signals in the red and green channels was quantified based on Manders' coefficient (modified Pearson correlation coefficient) (6, 32). M1 is defined as the ratio of the “summed intensities of pixels from the green image for which the intensity in the red channel is above zero” to the “total intensity in the green channel,” and M2 is defined conversely for the red image (6).
Fig 3
Fig 3
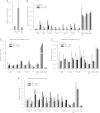
Effects of ganciclovir-mediated viral DNA replication inhibition on histone modification dynamics during hCMV infection. Growth-arrested MRC-5 cells were infected with the hCMV Towne strain at a multiplicity of 5 PFU/cell. At 8 h postinfection, cells either were treated with ganciclovir (+GCV) or were left untreated (−GCV). Cultures were given fresh medium (with or without the drug) at 28 h, and cells were analyzed at 8 h or 48 h postinfection. (A) DNA was quantified by real-time PCR, and mean viral DNA values (determined across five loci: MIE-P, UL32-T, UL54-P, UL54-T, and UL99-T) normalized to corresponding mean cellular DNA values (determined across three loci: GAPDH-T, RPL30-T, and HBG-P) derived from two biological and two technical replicates are presented with standard deviations. (B to E) Cells were subjected to ChIP using rabbit polyclonal antibodies directed against total H3 (B), H3K9/14ac (C), H3K9me2 (D), or H3K4me2 (E). Normal rabbit IgG was used to control for nonspecific precipitation. Quantitative PCR was performed on input and output (coprecipitated) DNA with primers complementary to the indicated viral and cellular genomic loci, and output-to-input ratios were calculated. Ratios from normal rabbit IgG ChIPs were subtracted from corresponding ratios obtained from total-H3 and modified-H3 reactions. Ratios from modified-H3 ChIPs were normalized to the corresponding ratios obtained from total-H3 reactions. Mean values with standard deviations derived from two biological and two technical replicates are presented as IgG-subtracted (B) or IgG-subtracted and H3-normalized (C to E) output-to-input DNA ratios. Student's t test was performed to check for the statistical significance of differences between −GCV and +GCV samples at 48 h postinfection (**, P < 0.001; *, P ≤ 0.004).
Fig 4
Fig 4
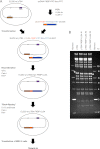
Construction of TBddUL54 viruses. (A) Schematic of the BAC recombineering procedure as described in Materials and Methods. (B) The identity and integrity of recombinant pTB4-FKBP-UL54 BACs (three independent clones, clones 1 to 3) was verified by comparison to the parental BAC (pTB4) following digestion with EcoRI and electrophoresis in a 0.7% agarose-Tris-acetate-EDTA gel stained with ethidium bromide. The FKBP-FRT insertion introduces an EcoRI site converting a 7.3-kb fragment in the pTB4 restriction reaction to 6.8-kb and 0.8-kb (not visible) fragments in the pTB4-FKBP-UL54 digests. The positions of the differentially occurring 7.3-kb and 6.8-kb bands are marked by asterisks.
Fig 5
Fig 5
Effects of viral DNA replication inhibition mediated by destabilized pUL54 on H3K4me2 dynamics during hCMV infection. Growth-arrested MRC-5 cells were infected with wild-type and mutant hCMV strains at a high multiplicity using equal amounts of infectious input viral genomes. (A and B) Infections were carried out with the hCMV TB40/E strain and a mutant TB40/E virus (TBddUL54) expressing pUL54 fused to a destabilizing domain (Fig. 4). (C and D) Infections were carried out with the hCMV AD169 strain and a mutant AD169 virus (ADddUL79) expressing pUL79 fused to a destabilizing domain. (A and C) At 8 h and 72 h postinfection, DNA was quantified by real-time PCR, and mean viral DNA values (determined across three loci: RS1-T, UL54-T, and UL99-T) normalized to corresponding mean cellular DNA values (determined at RPL30-T) derived from two biological and two technical replicates are presented with standard deviations. (B and D) At 8 h and 72 h postinfection, cells were subjected to ChIP using rabbit polyclonal antibodies directed against total H3 or H3K4me2. Normal rabbit IgG was used to control for nonspecific precipitation. Quantitative PCR was performed on input and output (coprecipitated) DNA with primers complementary to the indicated viral genomic loci, and output-to-input ratios were calculated. Ratios from normal rabbit IgG ChIPs were subtracted from the corresponding ratios obtained from total-H3 and H3K4me2 reactions. Ratios from H3K4me2 ChIPs were normalized to corresponding ratios obtained from total-H3 reactions. Mean values with standard deviations derived from two biological and two technical replicates are presented as IgG-subtracted and H3-normalized output-to-input DNA ratios. Student's t test was performed to check for the statistical significance of differences between wild-type and mutant viruses at 72 h postinfection (*, P < 0.0001).

Similar articles

Cited by

References

    1. Ahn JH, Jang WJ, Hayward GS. 1999. The human cytomegalovirus IE2 and UL112-113 proteins accumulate in viral DNA replication compartments that initiate from the periphery of promyelocytic leukemia protein-associated nuclear bodies (PODs or ND10). J. Virol. 73:10458–10471 - PMC - PubMed
    1. Atalay R, et al. 2002. Identification and expression of human cytomegalovirus transcription units coding for two distinct Fcγ receptor homologs. J. Virol. 76:8596–8608 - PMC - PubMed
    1. Banaszynski LA, Chen LC, Maynard-Smith LA, Ooi AG, Wandless TJ. 2006. A rapid, reversible, and tunable method to regulate protein function in living cells using synthetic small molecules. Cell 126:995–1004 - PMC - PubMed
    1. Barth TK, Imhof A. 2010. Fast signals and slow marks: the dynamics of histone modifications. Trends Biochem. Sci. 35:618–626 - PubMed
    1. Boeckh M, Geballe AP. 2011. Cytomegalovirus: pathogen, paradigm, and puzzle. J. Clin. Invest. 121:1673–1680 - PMC - PubMed

Publication types

MeSH terms

LinkOut - more resources