. 2012 Oct;13(5):609-27.
doi: 10.1007/s10162-012-0337-0. Epub 2012 Jul 3.

Over half the hair cells in the mouse utricle first appear after birth, with significant numbers originating from early postnatal mitotic production in peripheral and striolar growth zones

Affiliations

Over half the hair cells in the mouse utricle first appear after birth, with significant numbers originating from early postnatal mitotic production in peripheral and striolar growth zones

Joseph C Burns et al. J Assoc Res Otolaryngol. 2012 Oct.

Abstract

Many non-mammalian vertebrates produce hair cells throughout life and recover from hearing and balance deficits through regeneration. In contrast, embryonic production of hair cells declines sharply in mammals where deficits from hair cell losses are typically permanent. Hair cell density estimates recently suggested that the vestibular organs of mice continue to add hair cells after birth, so we undertook comprehensive counting in murine utricles at different ages. The counts show that 51% of the hair cells in adults arise during the 2 weeks after birth. Immature hair cells are most common near the neonatal macula's peripheral edge and striola, where anti-Ki-67 labels cycling nuclei in zones that appear to contain niches for supporting-cell-like stem cells. In vivo lineage tracing in a novel reporter mouse where tamoxifen-inducible supporting cell-specific Cre expression switched tdTomato fluorescence to eGFP fluorescence showed that proteolipid-protein-1-expressing supporting cells are an important source of the new hair cells. To assess the contributions of postnatal cell divisions, we gave mice an injection of BrdU or EdU on the day of birth. The labels were restricted to supporting cells 1 day later, but by 12 days, 31% of the labeled nuclei were in myosin-VIIA-positive hair cells. Thus, hair cell populations in neonatal mouse utricles grow appreciably through two processes: the progressive differentiation of cells generated before birth and the differentiation of new cells arising from divisions of progenitors that progress through S phase soon after birth. Subsequent declines in these processes coincide with maturational changes that appear unique to mammalian supporting cells.


Figures
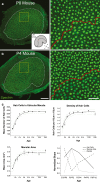
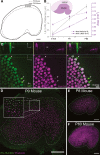
FIG. 1.
FIG. 1.
In the utricles of mice, 51 % of the hair cells first appear after birth. A, BLeft Confocal images show utricles from newborn (P0) (A) and 4-day-old (P4) (B) mice labeled with antibodies to spectrin (green). Spectrin labeling facilitates the identification of individual hair cells when imaged with a low magnification, high numerical aperture objective (image taken with ×20/0.75-NA objective). Scale bar, 100 μm. Inset diagram (bottom right in A) shows the macula and its anatomical orientation (A anterior, M medial, P posterior, L lateral; a dashed line marks the line of hair bundle polarity reversal). Right Zoomed regions within the yellow boxes on the left show hair cell cuticular plates individually resolved for counting. A red line marks the line of polarity reversal. Note the presence of hair cells with small cuticular plates distributed throughout the images from the P0 and P4 utricles and the higher spatial density of hair cells in the P4 utricle. Scale bar, 25 μm. C Graphs show hair cell numbers, hair cell density, macular area, and rates of change in those measures versus mouse age. Solid lines indicate von Bertalanffy equation fits; dashed lines indicate 95 % confidence intervals. Data are expressed as the mean ± SEM, n = 4 utricles per data point.
FIG. 2
FIG. 2
Lineage tracing in mice where tamoxifen injections switch PLP-expressing supporting cells from expressing tdTomato (red) to expressing eGFP (green) indicates that new hair cells arise from supporting cells. A Confocal images of a utricle from a P4 mT/mG;PLP-Cre mouse that received tamoxifen at P0 and P1. PLP does not appear to be expressed in the supporting cells within the striola. Hair bundles are labeled with fluorescent phalloidin (purple). The insets show low-magnification confocal images from a utricle of a P4 mT/mG;PLP-Cre mouse that did not receive tamoxifen. Note that there is no eGFP expression in the inset image on the right. Scale bars, 100 μm. B Zoomed confocal images of the utricle in (A). Left xy view at the level of the hair cell bundles. All hair bundles are labeled by fluorescent phalloidin (purple), and most appear magenta because those hair cells also express tdTomato (red). Arrows point to two hair cells that express eGFP in their bundles, which indicates that each arose from a PLP-expressing supporting cell or its lineage. Right xz view parallel to the long axis of the hair cells. Arrow indicates an eGFP-positive hair cell. Scale bar, 10 μm. C Graph of the mean number of eGFP-positive hair bundles in utricles from mT/mG;PLP-Cre mice that were fixed at various ages after they all received tamoxifen at P0 and P1. Asterisks indicate a significant difference compared to the P2 and P4 time points (p < 0.05, one-way ANOVA with Bonferonni’s multiple comparisons test). D, E Confocal images of utricles from P4 (D) and P23 (E) mT/mG;PLP-Cre mice that were harvested and cultured in the presence of 1.5 μM tamoxifen for 4 days. Utricles were fixed and eGFP (green) expression was imaged without antibody enhancement. Scale bar, 100 μm.
FIG. 3
FIG. 3
In neonatal mouse utricles, the macula expands along its peripheral edge and most noticeably at its lateral edge, a region containing many new hair cells. A The diagram illustrating the results of Fourier shape descriptor analysis for maculae from P0 and P80 mice suggests that the macula expands along its peripheral edge as mice mature, but with the most significant expansion occurring at the lateral edge (arrows). In these overlays, the lateral edge expands 30.5 ± 1 μm, n = 6 utricles per age. Scale bar, 50 μm. B The area of the utricle that is lateral to the reversal line expands substantially between birth and maturity. The graph shows area measurements of the regions of the macula lateral (solid purple line) and medial (dashed purple line) to the reversal line in E18.5, P0, and P80 mice. The representative macula in the inset shows the location of these two regions. The gray line on the graph shows the average distance between the lateral edge (LE) and reversal line (RL) at the same ages. Spectrin labeling was used to identify the line of reversal and the lateral edge (n = 6 utricles per age). Data are expressed as the mean ± SEM. C Confocal images show that GFP-expressing, Atoh1-positive, myosin VIIA-negative differentiating hair cells are present at the lateral edge of a utricle from a P1 Math1/nGFP transgenic mouse. Top xz views parallel to the long axis of the hair cells. Arrow marks an Atoh1-GFP-positive/myosin VIIA-negative cell that appears to be in contact with the basal lamina. Bottom xy view showing the apical surfaces of hair cells. Arrows mark three Atoh1-GFP-positive (green) cells that express considerably lower levels of myosin VIIA than the neighboring hair cells (purple). Scale bar, 10 μm. D Confocal image of a P0 mouse utricle labeled with phalloidin (purple) and an antibody to protocadherin-15-CD2 (PC-15-CD2, green), a marker for immature hair bundles. Scale bar, 100 μm. Zoomed inset shows the predominance of PC-15-CD2-labeled hair bundles at the macula's lateral edge. Scale bar, 10 μm. In utricles from P8 mice, fewer hair bundles are labeled with antibodies to protocadherin-15-CD2 (E) and no hair bundles are labeled in utricles from adult mice (F). Scale bars for (E, F), 100 μm.
FIG. 4
FIG. 4
In vivo BrdU labeling in the sensory and non-sensory epithelia of the utricle in mice during the 2 weeks after birth. For 3 days, BrdU was injected every 12 h, and on the morning of the fourth day, utricles were fixed and labeled with antibodies to BrdU (green) and myosin VIIA (purple). A The confocal image of the utricle from a mouse that was given BrdU from P0 to P2 shows many labeled cells in the non-sensory epithelium and smaller numbers of labeled cells within the macula. Zoomed-in regions (dashed boxes) show BrdU labeling within the macula (delineated by myosin VIIA labeling). B Fewer BrdU-positive nuclei are present in the non-sensory epithelium of a mouse that received BrdU from P6 to P8. Minimal labeling was detected in that macula. C Confocal image of a utricle from a mouse that received BrdU from P12 to P14 shows almost no BrdU labeling in the non-sensory epithelium and the macula. Scale bar, 100 μm. Scale bar in zoomed images, 20 μm.
FIG. 5
FIG. 5
Quantification of BrdU labeling revealed that early in life, hundreds of cells are dividing in the utricles of mice, but in the sensory epithelium most cells exit the cell cycle early in the week after birth. A Graph of the average number of BrdU-positive nuclei per macula in utricles from mice that received injections of BrdU every 12 h for 3 days prior to the indicated age. Sac age at sacrifice, BrdU age interval over which BrdU was administered. B Graph of the average number of BrdU-labeled nuclei in the band of non-sensory epithelium that is within 30 μm of the macula's edge. Note that the BrdU labeling in the non-sensory epithelium declines more slowly than the labeling in the macula (n = 4 utricles per age). Data are expressed as the mean ± SEM. C EdU incorporated into cycling cells and their progeny in vivo is still detectable (green) 1 week after injection. A confocal image of a utricle harvested at P1 from a mouse that received one injection of EdU at P0 shows a pattern similar to the utricles labeled by multiple daily injections of BrdU (Fig. 4). D Graph showing the rapid postnatal decrease in the number of EdU-positive nuclei per macula that were detected in utricles harvested 24 h after mice received a single injection of EdU. Dashed line is the fit of exponential equation shown. Data are expressed as the mean ± SEM, n = 4–5 utricles per age.
FIG. 6
FIG. 6
BrdU-positive nuclei are most common at the lateral edge and the medial striola in utricles from neonatal mice. A Histogram of the percentage of BrdU-positive nuclei in 10-μm intervals along the lateral–medial axis shows two spatially separate populations of proliferating cells in the macula of the neonatal mouse utricle. The largest population is at the lateral edge, and a smaller population is centered near the medial edge of the striola. The inset is a dot-plot showing pooled locations of BrdU-positive nuclei from P3 mouse utricles overlaid on a diagram of the macula (tan), with a dashed line marking the reversal line and the striola marked in light blue shading (n = 4). B Confocal image of a utricle from a P0 mouse labeled with antibodies to myosin VIIA and Ki-67. The pattern of Ki-67-positive cells is similar to the BrdU labeling pattern, although more cells are labeled. Scale bar, 100 μm.
FIG. 7
FIG. 7
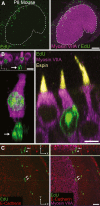
Cells from neonatal mice that incorporate EdU in vivo differentiate into hair cells that develop recognizable hair bundles and express hair cell markers. A Confocal image of a utricle from a mouse that was injected once with EdU (green) at P0 and harvested at P8 showing that cells and their progeny survive for days after incorporating EdU. Hair cells are labeled with an antibody to myosin VIIA (purple). Scale bar, 100 μm. B Confocal images of utricles from P8 mice that received one EdU injection at P0. Arrows in these panels indicate two EdU-positive supporting cell nuclei paired with two of the EdU-positive/myosin-VIIA-positive hair cells. Top left xz view parallel to the long axis of the hair cells. Scale bar, 10 μm. Bottom left Maximum-intensity projection of an EdU-positive hair cell/supporting cell pair. Right xz view of two EdU-negative and one EdU-positive hair cells that all show myosin-VIIA-positive labeling of their cell bodies and espin labeling of their hair bundles (yellow). Scale bar, 5 μm. C Confocal images of the edge of the utricular macula from a P8 mouse that was injected with EdU once at P0. These panels show two EdU-positive/myosin-VIIA-positive hair cells in the outermost row at the edge of the macula. Non-sensory epithelial cells are labeled by an antibody to E-cadherin (red). Top An xz view parallel to the long axis of the hair cells where the nucleus of an EdU-positive supporting cell (arrowhead) is paired with an EdU-positive/myosin-VIIA-positive hair cell (arrow). Bottom xy view: cross-sectional view at the level of the hair cell nuclei. Two EdU-positive/myosin-VIIA-positive cells are visible (arrows). Scale bar, 20 μm.
FIG. 8
FIG. 8
Temporal and spatial analyses show that significant numbers of hair cells differentiate from EdU-labeled cells or their progeny near the lateral edge of the utricle during the 2 weeks after birth. A Graph showing the absence of EdU-positive/myosin-VIIA-positive cells in EdU-labeled utricles harvested at P1 and the progressive increase in the percentage of EdU-positive cells (from 16 to 35 %) that became myosin-VIIa-positive in utricles harvested from mice at P5–P18, following EdU injection on P0. A significant increase in the percentage of EdU-positive/myosin-VIIA-positive cells occurred from P8 to P12 (*p < 0.05, one-way ANOVA with Bonferonni’s multiple comparisons test). Data are expressed as the mean ± SEM. B Histogram showing the percentage of EdU-positive/myosin-VIIA-positive hair cells in 10-μm intervals along the lateral–medial axis of utricles from P8 mice that received one EdU injection at P0. Dot-plot (inset) showing the pooled locations of newly produced (EdU-positive/myosin-VIIA-positive) hair cells overlaid on a diagram of the P8 macula (tan shading), with a dashed line marking the reversal line and the striola marked by light blue shading, as in the dot-plot of BrdU-labeled cells in Fig. 6 (n = 7 utricles). The postnatal production of hair cells occurs most frequently in a growth zone at the macula's lateral edge and another near its medial striola.
FIG. 9
FIG. 9
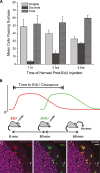
A Subcutaneous injection of EdU will only label utricular cells if they replicate DNA during the 1 h after the injection. A Graph of the numbers of singlet, doublet, and total EdU-positive nuclei labeled in the sensory epithelium of P0 mouse utricles that were harvested 1, 3, or 5 h after a single EdU injection. The total number of EdU-positive nuclei at the different harvest times changed little across that time span, consistent with the clearance of EdU occurring within 1 h. EdU singlets decreased from 1 to 5 h, while the EdU doublets increased as progenitor cells that labeled in the S phase completed mitosis and cytokinesis. The high incidence of singlets remaining at 5 h shows that cell cycle times vary in this population and can extend beyond 4 h (n = 4 utricles). Data are expressed as the mean ± SEM. BTop An illustration of the EdU/BrdU co-labeling protocol used to measure the EdU clearance time. P0 mice received one injection of EdU, followed 30 min later by one injection of BrdU. Some utricles were harvested 30 min after the BrdU injection and others after 1 h. The presence of EdU-negative/BrdU-positive nuclei shows that only BrdU was available for incorporation into those cells' replicating DNA and established that the EdU was already cleared at the time of the BrdU injection. Bottom Confocal image of a utricle that was harvested 30 min after the BrdU injection and 1 h after the EdU injection. EdU-positive/BrdU-negative (arrowhead) and EdU-negative/BrdU-positive nuclei (arrow) are present in the sensory and non-sensory epithelia. EdU-negative/BrdU-positive nuclei were detected in all utricles harvested 30 min and 1 h after the BrdU injection, indicating that EdU is cleared in ≤1 h. As a control (not shown in the illustration), EdU and BrdU were injected into P0 mice simultaneously and the utricles harvested 1 h later. In the utricles from the co-injected (control) mice, all the labeled nuclei were detectably EdU-positive/BrdU-positive (n = 4 utricles). Scale bar, 20 μm.

Similar articles

Cited by

References

    1. Ahmed ZM, Goodyear R, Riazuddin S, Lagziel A, Legan PK, Behra M, Burgess SM, Lilley KS, Wilcox ER, Griffith AJ, Frolenkov GI, Belyantseva IA, Richardson GP, Friedman TB. The tip-link antigen, a protein associated with the transduction complex of sensory hair cells, is protocadherin-15. J Neurosci. 2006;26:7022–7034. doi: 10.1523/JNEUROSCI.1163-06.2006. - DOI - PMC - PubMed
    1. Bermingham NA, Hassan BA, Price SD, Vollrath MA, Ben-Arie N, Eatock RA, Bellen HJ, Lysakowski A, Zoghbi HY. Math1: an essential gene for the generation of inner ear hair cells. Science. 1999;284:1837–1841. doi: 10.1126/science.284.5421.1837. - DOI - PubMed
    1. Bertalanffy L. Untersuchungen Über die Gesetzlichkeit des Wachstums. I. Allgemeine Grundlagen der Theorie; mathematische und physiologische Gesetzlichkeiten des Wachstums bei Wassertieren. Arch Entwicklungsmech. 1934;131:613–652. doi: 10.1007/BF00650112. - DOI - PubMed
    1. Brigande JV, Heller S. Quo vadis, hair cell regeneration? Nat Neurosci. 2009;12:679–685. doi: 10.1038/nn.2311. - DOI - PMC - PubMed
    1. Burns JC, Christophel JJ, Collado MS, Magnus C, Carfrae M, Corwin JT. Reinforcement of cell junctions correlates with the absence of hair cell regeneration in mammals and its occurrence in birds. J Comp Neurol. 2008;511:396–414. doi: 10.1002/cne.21849. - DOI - PMC - PubMed

Publication types

LinkOut - more resources