Aβ₁₋₄₂-RAGE interaction disrupts tight junctions of the blood-brain barrier via Ca²⁺-calcineurin signaling
- PMID: 22745485
- PMCID: PMC6622350
- DOI: 10.1523/JNEUROSCI.6102-11.2012
Aβ₁₋₄₂-RAGE interaction disrupts tight junctions of the blood-brain barrier via Ca²⁺-calcineurin signaling
Abstract
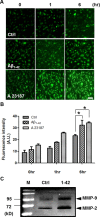
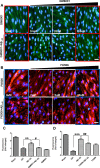
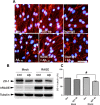
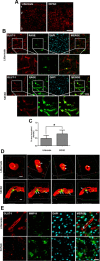
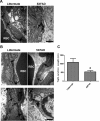
The blood-brain barrier (BBB), which is formed by adherens and tight junctions (TJs) of endothelial cells, maintains homeostasis of the brain. Disrupted intracellular Ca²⁺ homeostasis and breakdown of the BBB have been implicated in the pathogenesis of Alzheimer's disease (AD). The receptor for advanced glycation end products (RAGE) is known to interact with amyloid β-peptide (Aβ) and mediate Aβ transport across the BBB, contributing to the deposition of Aβ in the brain. However, molecular mechanisms underlying Aβ-RAGE interaction-induced alterations in the BBB have not been identified. We found that Aβ₁₋₄₂ induces enhanced permeability, disruption of zonula occludin-1 (ZO-1) expression in the plasma membrane, and increased intracellular calcium and matrix metalloproteinase (MMP) secretion in cultured endothelial cells. Neutralizing antibodies against RAGE and inhibitors of calcineurin and MMPs prevented Aβ₁₋₄₂-induced changes in ZO-1, suggesting that Aβ-RAGE interactions alter TJ proteins through the Ca²⁺-calcineurin pathway. Consistent with these in vitro findings, we found disrupted microvessels near Aβ plaque-deposited areas, elevated RAGE expression, and enhanced MMP secretion in microvessels of the brains of 5XFAD mice, an animal model for AD. We have identified a potential molecular pathway underlying Aβ-RAGE interaction-induced breakage of BBB integrity. This pathway might play an important role in the pathogenesis of AD.
Figures

Similar articles
-
Disruption of blood-brain barrier in Alzheimer disease pathogenesis.Tissue Barriers. 2013 Apr 1;1(2):e23993. doi: 10.4161/tisb.23993. Tissue Barriers. 2013. PMID: 24665385 Free PMC article.
-
Aβ1-42 reduces P-glycoprotein in the blood-brain barrier through RAGE-NF-κB signaling.Cell Death Dis. 2014 Jun 26;5(6):e1299. doi: 10.1038/cddis.2014.258. Cell Death Dis. 2014. PMID: 24967961 Free PMC article.
-
The potential mechanisms of Aβ-receptor for advanced glycation end-products interaction disrupting tight junctions of the blood-brain barrier in Alzheimer's disease.Int J Neurosci. 2014 Feb;124(2):75-81. doi: 10.3109/00207454.2013.825258. Epub 2013 Aug 15. Int J Neurosci. 2014. PMID: 23855502 Review.
-
EGb761 provides a protective effect against Aβ1-42 oligomer-induced cell damage and blood-brain barrier disruption in an in vitro bEnd.3 endothelial model.PLoS One. 2014 Nov 26;9(11):e113126. doi: 10.1371/journal.pone.0113126. eCollection 2014. PLoS One. 2014. PMID: 25426944 Free PMC article.
-
Preventing activation of receptor for advanced glycation endproducts in Alzheimer's disease.Curr Drug Targets CNS Neurol Disord. 2005 Jun;4(3):249-66. doi: 10.2174/1568007054038210. Curr Drug Targets CNS Neurol Disord. 2005. PMID: 15975028 Review.
Cited by
-
Blood-Brain Barrier: More Contributor to Disruption of Central Nervous System Homeostasis Than Victim in Neurological Disorders.Front Neurosci. 2020 Aug 6;14:764. doi: 10.3389/fnins.2020.00764. eCollection 2020. Front Neurosci. 2020. PMID: 32903669 Free PMC article. Review.
-
Selective loss of cortical endothelial tight junction proteins during Alzheimer's disease progression.Brain. 2019 Apr 1;142(4):1077-1092. doi: 10.1093/brain/awz011. Brain. 2019. PMID: 30770921 Free PMC article.
-
Insulin Resistance as a Link between Amyloid-Beta and Tau Pathologies in Alzheimer's Disease.Front Aging Neurosci. 2017 May 3;9:118. doi: 10.3389/fnagi.2017.00118. eCollection 2017. Front Aging Neurosci. 2017. PMID: 28515688 Free PMC article.
-
Pathophysiological Role of Microglial Activation Induced by Blood-Borne Proteins in Alzheimer's Disease.Biomedicines. 2023 May 7;11(5):1383. doi: 10.3390/biomedicines11051383. Biomedicines. 2023. PMID: 37239054 Free PMC article. Review.
-
Advanced Human BBB-on-a-Chip: A New Platform for Alzheimer's Disease Studies.Adv Healthc Mater. 2021 Aug;10(15):e2002285. doi: 10.1002/adhm.202002285. Epub 2021 Jun 2. Adv Healthc Mater. 2021. PMID: 34075728 Free PMC article. Review.
References
-
- Agostinho P, Lopes JP, Velez Z, Oliveira CR. Overactivation of calcineurin induced by amyloid-beta and prion proteins. Neurochem Int. 2008;52:1226–1233. - PubMed
-
- Banks WA, Kastin AJ, Maness LM, Banks MF, Shayo M, McLay RN. Interactions of beta-amyloids with the blood-brain barrier. Ann N Y Acad Sci. 1997;826:190–199. - PubMed
-
- Bond M, Fabunmi RP, Baker AH, Newby AC. Synergistic upregulation of metalloproteinase-9 by growth factors and inflammatory cytokines: an absolute requirement for transcription factor NF-kappa B. FEBS Lett. 1998;435:29–34. - PubMed
-
- Cho HJ, Son SM, Jin SM, Hong HS, Shin DH, Kim SJ, Huh K, Mook-Jung I. RAGE regulates BACE1 and Abeta generation via NFAT1 activation in Alzheimer's disease animal model. FASEB J. 2009;23:2639–2649. - PubMed
Publication types
MeSH terms
Substances
LinkOut - more resources
Full Text Sources
Medical
Molecular Biology Databases
Miscellaneous
