

Identification of human germinal center light and dark zone cells and their relationship to human B-cell lymphomas
- PMID: 22740445
- PMCID: PMC3447782
- DOI: 10.1182/blood-2012-03-415380
Identification of human germinal center light and dark zone cells and their relationship to human B-cell lymphomas
Erratum in
- Blood. 2015 Sep 3;126(10):1262
Abstract
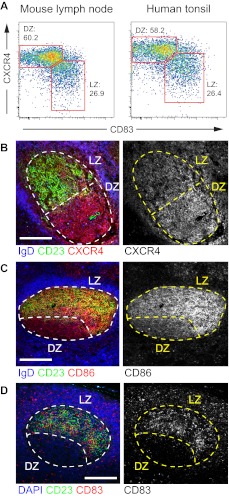
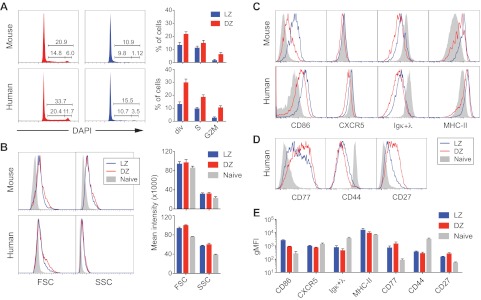
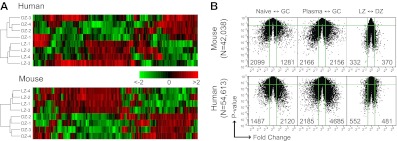
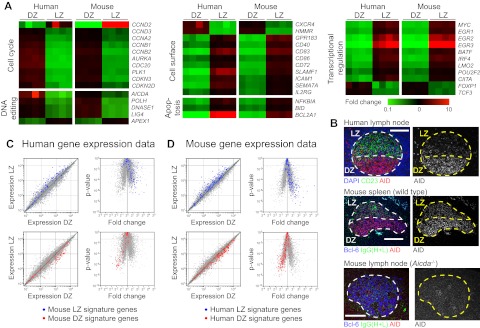
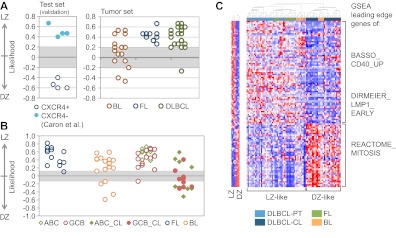
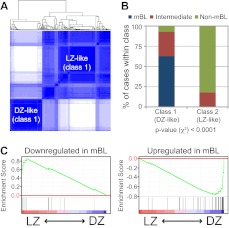
Germinal centers (GCs) are sites of B-cell clonal expansion, hypermutation, and selection. GCs are polarized into dark (DZ) and light zones (LZ), a distinction that is of key importance to GC selection. However, the difference between the B cells in each of these zones in humans remains unclear. We show that, as in mice, CXCR4 and CD83 can be used to distinguish human LZ and DZ cells. Using these markers, we show that LZ and DZ cells in mice and humans differ only in the expression of characteristic "activation" and "proliferation" programs, suggesting that these populations represent alternating states of a single-cell type rather than distinct differentiation stages. In addition, LZ/DZ transcriptional profiling shows that, with the exception of "molecular" Burkitt lymphomas, nearly all human B-cell malignancies closely resemble LZ cells, which has important implications for our understanding of the molecular programs of lymphomagenesis.
Figures
Comment in
-
B-cell lymphomas: getting in the zone!Blood. 2012 Sep 13;120(11):2158-9. doi: 10.1182/blood-2012-07-441238. Blood. 2012. PMID: 22977079 No abstract available.
Similar articles
-
Germinal Center B Cells Replace Their Antigen Receptors in Dark Zones and Fail Light Zone Entry when Immunoglobulin Gene Mutations are Damaging.Immunity. 2018 Sep 18;49(3):477-489.e7. doi: 10.1016/j.immuni.2018.08.025. Immunity. 2018. PMID: 30231983 Free PMC article.
-
Fibrinogen is localized on dark zone follicular dendritic cells in vivo and enhances the proliferation and survival of a centroblastic cell line in vitro.J Leukoc Biol. 2007 Sep;82(3):666-77. doi: 10.1189/jlb.0107050. Epub 2007 Jun 5. J Leukoc Biol. 2007. PMID: 17550975
-
Determining the Origin of Human Germinal Center B Cell-Derived Malignancies.Methods Mol Biol. 2017;1623:253-279. doi: 10.1007/978-1-4939-7095-7_20. Methods Mol Biol. 2017. PMID: 28589362
-
Germinal centres and B cell lymphomagenesis.Nat Rev Immunol. 2015 Mar;15(3):172-84. doi: 10.1038/nri3814. Nat Rev Immunol. 2015. PMID: 25712152 Review.
-
Expression of apoptosis regulators in germinal centers and germinal center-derived B-cell lymphomas: insight into B-cell lymphomagenesis.Pathol Int. 2007 Jul;57(7):391-7. doi: 10.1111/j.1440-1827.2007.02115.x. Pathol Int. 2007. PMID: 17587238 Review.
Cited by
-
The case of the missing c-Myc.Nat Immunol. 2012 Nov;13(11):1029-31. doi: 10.1038/ni.2455. Nat Immunol. 2012. PMID: 23080195 No abstract available.
-
IL-4-Induced Quiescence of Resting Naive B Cells Is Disrupted in Systemic Lupus Erythematosus.J Immunol. 2022 Oct 15;209(8):1513-1522. doi: 10.4049/jimmunol.2200409. Epub 2022 Sep 7. J Immunol. 2022. PMID: 36165181 Free PMC article.
-
Functional disparities among BCL-2 members in tonsillar and leukemic B-cell subsets assessed by BH3-mimetic profiling.Cell Death Differ. 2017 Jan;24(1):111-119. doi: 10.1038/cdd.2016.105. Epub 2016 Sep 30. Cell Death Differ. 2017. PMID: 27689871 Free PMC article.
-
An Integrated Multi-omic Single-Cell Atlas of Human B Cell Identity.Immunity. 2020 Jul 14;53(1):217-232.e5. doi: 10.1016/j.immuni.2020.06.013. Immunity. 2020. PMID: 32668225 Free PMC article.
-
The genetic landscape of diffuse large B-cell lymphoma.Semin Hematol. 2015 Apr;52(2):67-76. doi: 10.1053/j.seminhematol.2015.01.005. Epub 2015 Jan 17. Semin Hematol. 2015. PMID: 25805586 Free PMC article. Review.
References
-
- Victora GD, Nussenzweig MC. Germinal centers. Annu Rev Immunol. 2012;30:429–457. - PubMed
-
- MacLennan IC. Germinal centers. Annu Rev Immunol. 1994;12:117–139. - PubMed
-
- Klein U, Dalla-Favera R. Germinal centres: role in B-cell physiology and malignancy. Nat Rev Immunol. 2008;8(1):22–33. - PubMed
-
- Wagner SD, Neuberger MS. Somatic hypermutation of immunoglobulin genes. Annu Rev Immunol. 1996;14:441–457. - PubMed
Publication types
MeSH terms
Substances
Associated data
- Actions
- Actions
Grants and funding
LinkOut - more resources
Full Text Sources
Other Literature Sources
Molecular Biology Databases
Miscellaneous
