. 2012 Jun 22;149(7):1578-93.
doi: 10.1016/j.cell.2012.04.037.

Gut immune maturation depends on colonization with a host-specific microbiota

Affiliations

Gut immune maturation depends on colonization with a host-specific microbiota

Hachung Chung et al. Cell. .

Abstract

Gut microbial induction of host immune maturation exemplifies host-microbe mutualism. We colonized germ-free (GF) mice with mouse microbiota (MMb) or human microbiota (HMb) to determine whether small intestinal immune maturation depends on a coevolved host-specific microbiota. Gut bacterial numbers and phylum abundance were similar in MMb and HMb mice, but bacterial species differed, especially the Firmicutes. HMb mouse intestines had low levels of CD4(+) and CD8(+) T cells, few proliferating T cells, few dendritic cells, and low antimicrobial peptide expression--all characteristics of GF mice. Rat microbiota also failed to fully expand intestinal T cell numbers in mice. Colonizing GF or HMb mice with mouse-segmented filamentous bacteria (SFB) partially restored T cell numbers, suggesting that SFB and other MMb organisms are required for full immune maturation in mice. Importantly, MMb conferred better protection against Salmonella infection than HMb. A host-specific microbiota appears to be critical for a healthy immune system.


Figures

Figure 1
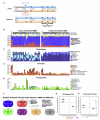
Figure 1. MMb and HMb Mouse Gut Microbiotas Are Similar in Major Bacterial Phyla Abundance with Differences at the OTU Level
(A) Schematic of colonization model (see text for details) is illustrated. Blue and red arrowheads indicate fecal pellet collection for bacterial 16S rDNA sequencing. Offspring were sacrificed for immune system analysis. (B) Relative abundance of major bacterial phyla in the gut microbiota from MMb and HMb mice is shown. P0, parents; F1, first-generation offspring; F2, secondgeneration offspring. Each bar represents an individual mouse. Apparent differences in the Firmicutes-to-Bacteroidetes ratio between inoculum samples and recipients may have resulted from the observed differential DNA extraction performances of fecal suspensions (high water content) and fecal pellets (low water content). (C–E) Detailed relative abundance of bacterial taxa in the three most abundant major phyla is presented. (F) Number (percentage) of shared OTUs in each major bacterial phylum in MMb and HMb fecal pellets is demonstrated. See also Figures S1D and S1E. (G and H) Gut microbial communities from individual mice, clustered according to principal coordinates analysis of unweighted UniFrac distances, is illustrated. Percentages of variation explained by plotted principal coordinates P1 and P2 are indicated on the x and y axes, respectively.
Figure 2
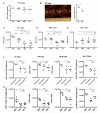
Figure 2. MMb Mice Have More Small Intestinal T Cells Than Do HMb Mice
(A and B) IELs were extracted from the small intestine; the remaining LP tissue was digested. Absolute numbers of CD3+CD103+TCRβ+ among IELs (B) and CD3+CD4+ and CD3+CD8+ cells from LP (A) were quantitated by flow cytometry and normalized to small intestine length. SPF and GF SW mice were age matched. See also Figures S2A and S2B. *p < 0.05, **p < 0.01, ***p < 0.001. NS, not significant. (C) Sections of small intestine were stained with FITC-conjugated antibody to CD3 (green) and counterstained with DAPI (blue).
Figure 3
Figure 3. The MMb, but Not the HMb or RMb, Expands T Cell Populations in Small Intestinal Tissue and Secondary Gut Lymphoid Organs
(A–C) PP number (A) and average PP size (B) per small intestine were compared. PPs were mashed, stained for CD3, and subjected to flow cytometry (C). See also Figures S3A and S3B. (D and E) Total T cell numbers in MLNs (D) and spleen (E) are shown. See also Figures S3C–S3G. (F) GF mice (3–4 weeks old) were orally gavaged with the original mouse (M) or human (H) inoculum or with feces pooled from ten additional human donors (H10 inoculum). T cell numbers were measured after 4 weeks of colonization. (G) GF mice were orally gavaged with Sprague-Dawley rat feces and bred in vinyl isolators to obtain RMb offspring. T cell numbers in age-matched MMb, HMb, and RMb offspring were compared. *p < 0.05, **p < 0.01, ***p < 0.001. NS, not significant.
Figure 4
Figure 4. Host-Specific Gut Microbiota Induction of T Cell Proliferation in Secondary Gut Lymphoid Organs Leads to Expansion of Small Intestinal T Cells
(A) Representative flow cytometry plots of CD44hiCD62Llo (effector/memory) and CD44loCD62Lhi (naive) expression on CD3+CD4+ T cells in PPs of MMb and HMb offspring are presented. Numbers indicate cell percentages in the quadrant. (B) Combined data for PP CD3+CD4+ and CD3+CD8+ cells (n = 7) are illustrated. (C) Mice injected with BrdU were sacrificed 2 hr later. CD3+ T cells were stained with FITC-conjugated antibody to BrdU for detection of proliferating cells. See also Figures S4A–S4C. *p < 0.05, **p < 0.01, ***p < 0.001. NS, not significant.
Figure 5
Figure 5. Distinct Gene Expression Profile in Small Intestinal T Cells from HMb Mice
(A) Microarray analysis comparing CD4+ T cell gene expression in GF mice with that in HMb mice (left) and MMb mice (right) is demonstrated. CD4+ T cells were sorted from spleen (SPL), MLNs, and small intestinal LP. Data are mean values from three to five independent experiments. Numbers indicate genes showing a ≥2-fold difference in expression between groups; red numbers indicate overexpression and blue numbers underexpression. (B) Fold change versus fold-change analysis compares MMb mice with GF mice in terms of gene expression in CD4+ T cells sorted from MLNs (y axis) and spleen (x axis) (left). A heatmap (right) shows differentially expressed genes in CD4+ T cells sorted from the MLN. Some genes (Hspa1a, Socs3) were detected with multiple probes. Genes with the highest and lowest transcript levels are red and blue, respectively. See also Figure S5A. (C) Fold change versus fold-change analysis compares gene expression in CD4+ T cells sorted from small intestinal LP of GF mice versus MMb mice (y axis) or HMb mice (x axis). (D) Heatmap shows differential cytokine expression in CD4+ T cells from small intestinal LP. Data are from three independent experiments. See also Figures S5B–S5F. *p < 0.05, MMb versus GF; **p < 0.05, HMb versus GF; ***p < 0.05, HMb versus MMb.
Figure 6
Figure 6. SFB Play a Role in Rescuing Intestinal T Cell Numbers and Exhibit Host Specificity
(A) Abundance of SFB in MMb, HMb, and SFB-monocolonized mice, measured as SFB-specific 16S rDNA copy numbers by qPCR analysis of fecal pellets, is shown. Inset values indicate number of SFB 16S rDNA copies/ml in inocula. ND, not detected. (B and C) Absolute T cell numbers in IEL (CD3+CD103+TCRb+) and PP (CD3+CD4+ and CD3+CD8+) compartments of MMb, SFB-monocolonized, and GF mice (B) and HMb mice cohoused with MMb or SFB-monocolonized mice for 4 weeks (C) are presented. In (C), as a negative control, HMb mice were cohoused with HMb mice. See also Figures S6A–S6E.
Figure 7
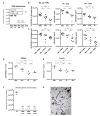
Figure 7. MMb Confers Better Protection against Salmonella enterica Serovar Typhimurium Than HMb
(A–C) Mice colonized with different microbiotas were orally gavaged with ~1 × 10⁷ salmonellae; the Salmonella load in fecal pellets was measured daily (A). Mice were sacrificed on day 4 after infection, and the Salmonella load in the spleen was measured (B). Cecal sections were stained with hematoxylin and eosin, and disease was scored (C). ***p < 0.001. (D and E) Number of CD3+CD4+ T cells in PPs expressing RORgt+ (D) and Foxp3+ (E), as derived by intracellular staining and flow cytometry, is illustrated. See alsoFigures S6F–S6G. (F) Abundance of SFB in fecal samples from Sprague-Dawley rats and RMb-colonized mice, measured as SFB-specific 16S rDNA copy numbers by qPCR, is shown. Fecal pellets from RMb parents were collected on postgavage days 3 (RMb P 3d) and 29 (RMb P 29d); those from RMb offspring were collected at 6 weeks of age (RMb F1 6w). ND, not detected. (G) Gram-stained Sprague-Dawley rat fecal pellets resuspended in PBS are illustrated. Blue arrows indicate bacteria with long filamentous structures representative of SFB. *p < 0.05, **p < 0.01, ***p < 0.001. NS, not significant.

Comment in

Similar articles

Cited by

References

    1. Arumugam M, Raes J, Pelletier E, Le Paslier D, Yamada T, Mende DR, Fernandes GR, Tap J, Bruls T, Batto JM, et al. MetaHIT Consortium Enterotypes of the human gut microbiome. Nature. 2011;473:174–180. - PMC - PubMed
    1. Atarashi K, Tanoue T, Shima T, Imaoka A, Kuwahara T, Momose Y, Cheng G, Yamasaki S, Saito T, Ohba Y, et al. Induction of colonic regulatory T cells by indigenous Clostridium species. Science. 2011;331:337–341. - PMC - PubMed
    1. Bandeira A, Mota-Santos T, Itohara S, Degermann S, Heusser C, Tonegawa S, Coutinho A. Localization of gamma/delta T cells to the intestinal epithelium is independent of normal microbial colonization. J. Exp. Med. 1990;172:239–244. - PMC - PubMed
    1. Chassin C, Kocur M, Pott J, Duerr CU, Gütle D, Lotz M, Hornef MW. miR-146a mediates protective innate immune tolerance in the neonate intestine. Cell Host Microbe. 2010;8:358–368. - PubMed
    1. Chung H, Kasper DL. Microbiota-stimulated immune mechanisms to maintain gut homeostasis. Curr. Opin. Immunol. 2010;22:455–460. - PubMed

Publication types

MeSH terms