RhoB regulates cell migration through altered focal adhesion dynamics
- PMID: 22724071
- PMCID: PMC3376739
- DOI: 10.1098/rsob.120076
RhoB regulates cell migration through altered focal adhesion dynamics
Abstract
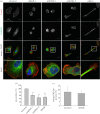
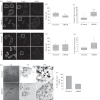
The Rho GTPase RhoB has been shown to affect cell migration, but how it does this is not clear. Here we show that cells depleted of RhoB by RNAi are rounded and have defects in Rac-mediated spreading and lamellipodium extension, although they have active membrane ruffling around the periphery. Depletion of the exchange factor GEF-H1 induces a similar phenotype. RhoB-depleted cells migrate faster, but less persistently in a chemotactic gradient, and frequently round up during migration. RhoB-depleted cells have similar numbers of focal adhesions to control cells during spreading and migration, but show more diffuse and patchy contact with the substratum. They have lower levels of surface β1 integrin, and β1 integrin activity is reduced in actin-rich protrusions. We propose that RhoB contributes to directional cell migration by regulating β1 integrin surface levels and activity, thereby stabilizing lamellipodial protrusions.
Keywords: Rac1; Rho guanosine triphosphate; RhoB; cytoskeleton; focal adhesions; integrins.
Figures


Similar articles
-
XPLN, a guanine nucleotide exchange factor for RhoA and RhoB, but not RhoC.J Biol Chem. 2002 Nov 8;277(45):42964-72. doi: 10.1074/jbc.M207401200. Epub 2002 Sep 6. J Biol Chem. 2002. PMID: 12221096
-
Guanine nucleotide exchange factor-H1 regulates cell migration via localized activation of RhoA at the leading edge.Mol Biol Cell. 2009 Sep;20(18):4070-82. doi: 10.1091/mbc.e09-01-0041. Epub 2009 Jul 22. Mol Biol Cell. 2009. PMID: 19625450 Free PMC article.
-
Heparanase-induced GEF-H1 signaling regulates the cytoskeletal dynamics of brain metastatic breast cancer cells.Mol Cancer Res. 2012 Jun;10(6):689-702. doi: 10.1158/1541-7786.MCR-11-0534. Epub 2012 Apr 18. Mol Cancer Res. 2012. PMID: 22513363 Free PMC article.
-
Rac-GTPases and Rac-GEFs in neutrophil adhesion, migration and recruitment.Eur J Clin Invest. 2018 Nov;48 Suppl 2(Suppl Suppl 2):e12939. doi: 10.1111/eci.12939. Epub 2018 May 11. Eur J Clin Invest. 2018. PMID: 29682742 Free PMC article. Review.
-
Parallels between single cell migration and barrier formation: The case of RhoB and Rac1 trafficking.Small GTPases. 2018 Jul 4;9(4):332-338. doi: 10.1080/21541248.2016.1231655. Epub 2016 Sep 30. Small GTPases. 2018. PMID: 27598909 Free PMC article. Review.
Cited by
-
MicroRNAs regulate tight junction proteins and modulate epithelial/endothelial barrier functions.Tissue Barriers. 2014 Aug 8;2(4):e944446. doi: 10.4161/21688362.2014.944446. eCollection 2014. Tissue Barriers. 2014. PMID: 25610754 Free PMC article.
-
Plakophilin 2 affects cell migration by modulating focal adhesion dynamics and integrin protein expression.J Invest Dermatol. 2014 Jan;134(1):112-122. doi: 10.1038/jid.2013.266. Epub 2013 Jun 13. J Invest Dermatol. 2014. PMID: 23884246 Free PMC article.
-
Impaired microtubule dynamics contribute to microthrombocytopenia in RhoB-deficient mice.Blood Adv. 2022 Sep 13;6(17):5184-5197. doi: 10.1182/bloodadvances.2021006545. Blood Adv. 2022. PMID: 35819450 Free PMC article.
-
The RhoB small GTPase in physiology and disease.Small GTPases. 2018 Sep 3;9(5):384-393. doi: 10.1080/21541248.2016.1253528. Epub 2016 Nov 22. Small GTPases. 2018. PMID: 27875099 Free PMC article. Review.
-
Loss of RhoA promotes skin tumor formation and invasion by upregulation of RhoB.Oncogene. 2018 Feb 15;37(7):847-860. doi: 10.1038/onc.2017.333. Epub 2017 Oct 23. Oncogene. 2018. PMID: 29059167
References
-
- Jaffe AB, Hall A. 2005. Rho GTPases: biochemistry and biology. Annu. Rev. Cell Dev. Biol. 21, 247–26910.1146/annurev.cellbio.21.020604.150721 (doi:10.1146/annurev.cellbio.21.020604.150721) - DOI - DOI - PubMed
-
- Adamson P, Marshall CJ, Hall A, Tilbrook PA. 1992. Post-translational modifications of p21rho proteins. J. Biol. Chem. 267, 20 033–20 038 - PubMed
-
- Roberts PJ, et al. 2008. Rho family GTPase modification and dependence on CAAX motif-signaled posttranslational modification. J. Biol. Chem. 283, 25 150–25 16310.1074/jbc.M800882200 (doi:10.1074/jbc.M800882200) - DOI - DOI - PMC - PubMed
-
- Michaelson D, Silletti J, Murphy G, D'Eustachio P, Rush M, Philips MR. 2001. Differential localization of Rho GTPases in live cells: regulation by hypervariable regions and RhoGDI binding. J. Cell Biol. 152, 111–12610.1083/jcb.152.1.111 (doi:10.1083/jcb.152.1.111) - DOI - DOI - PMC - PubMed
-
- Fernandez-Borja M, Janssen L, Verwoerd D, Hordijk P, Neefjes J. 2005. RhoB regulates endosome transport by promoting actin assembly on endosomal membranes through Dia1. J. Cell Sci. 118, 2661–267010.1242/jcs.02384 (doi:10.1242/jcs.02384) - DOI - DOI - PubMed
Publication types
MeSH terms
Substances
LinkOut - more resources
Full Text Sources
Research Materials
Miscellaneous

