

Neuronavigation-guided focused ultrasound-induced blood-brain barrier opening: a preliminary study in swine
- PMID: 22723060
- PMCID: PMC7966321
- DOI: 10.3174/ajnr.A3150
Neuronavigation-guided focused ultrasound-induced blood-brain barrier opening: a preliminary study in swine
Abstract
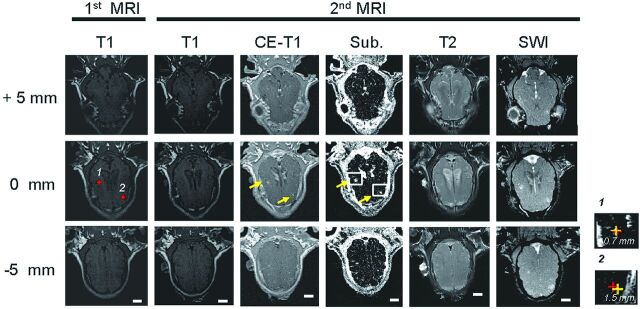
Background and purpose: FUS-induced BBB opening is a promising technique for noninvasive and local delivery of drugs into the brain. Here we propose the novel use of a neuronavigation system to guide the FUS-induced BBB opening procedure and investigate its feasibility in vivo in large animals.
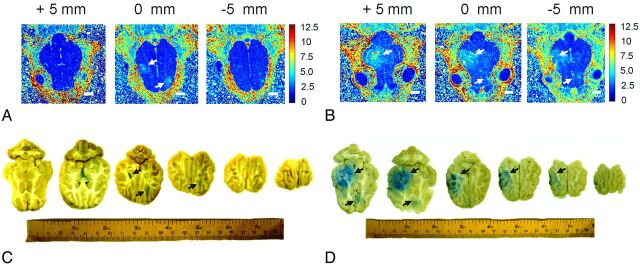
Materials and methods: We developed an interface between the neuronavigator and FUS to allow guidance of the focal energy produced by the FUS transducer. The system was tested in 29 swine by more than 40 sonication procedures and evaluated by MR imaging. Gd-DTPA concentration was quantitated in vivo by MR imaging R1 relaxometry and compared with ICP-OES assay. Brain histology after FUS exposure was investigated using H&E and TUNEL staining.
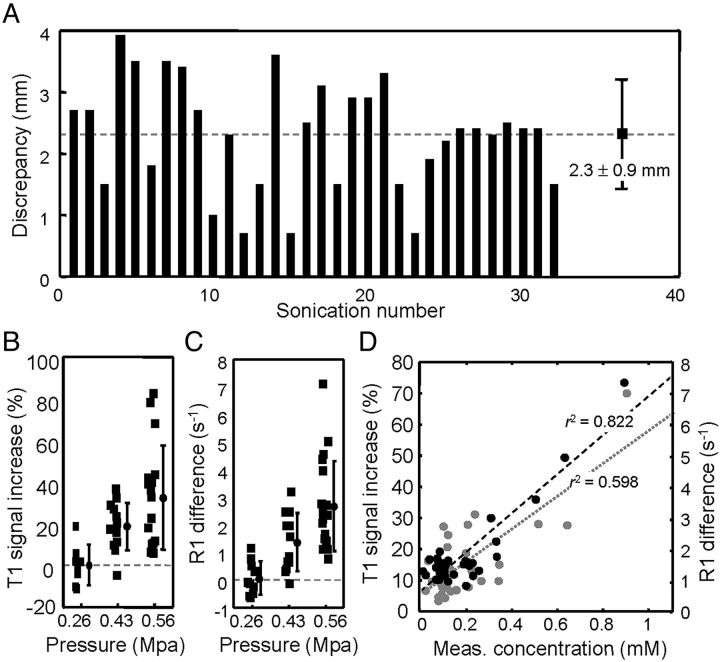
Results: Neuronavigation could successfully guide the focal beam, with precision comparable to neurosurgical stereotactic procedures (2.3 ± 0.9 mm). A FUS pressure of 0.43 MPa resulted in consistent BBB opening. Neuronavigation-guided BBB opening increased Gd-DTPA deposition by up to 1.83 mmol/L (a 140% increase). MR relaxometry demonstrated high correlation with ICP-OES measurements (r(2) = 0.822), suggesting that Gd-DTPA deposition can be directly measured by imaging.
Conclusions: Neuronavigation provides sufficient precision for guiding FUS to temporally and locally open the BBB. Gd-DTPA deposition in the brain can be quantified by MR relaxometry, providing a potential tool for the in vivo quantification of therapeutic agents in CNS disease treatment.
Figures
Similar articles
-
Safety evaluation of a clinical focused ultrasound system for neuronavigation guided blood-brain barrier opening in non-human primates.Sci Rep. 2021 Jul 22;11(1):15043. doi: 10.1038/s41598-021-94188-3. Sci Rep. 2021. PMID: 34294761 Free PMC article.
-
Characterization of the Targeting Accuracy of a Neuronavigation-Guided Transcranial FUS System In Vitro, In Vivo, and In Silico.IEEE Trans Biomed Eng. 2023 May;70(5):1528-1538. doi: 10.1109/TBME.2022.3221887. Epub 2023 Apr 20. IEEE Trans Biomed Eng. 2023. PMID: 36374883 Free PMC article.
-
A Clinical System for Non-invasive Blood-Brain Barrier Opening Using a Neuronavigation-Guided Single-Element Focused Ultrasound Transducer.Ultrasound Med Biol. 2020 Jan;46(1):73-89. doi: 10.1016/j.ultrasmedbio.2019.09.010. Epub 2019 Oct 25. Ultrasound Med Biol. 2020. PMID: 31668690 Free PMC article.
-
A review of potential applications of MR-guided focused ultrasound for targeting brain tumor therapy.Neurosurg Focus. 2018 Feb;44(2):E10. doi: 10.3171/2017.11.FOCUS17620. Neurosurg Focus. 2018. PMID: 29385922 Review.
-
Innovative Applications of MR-Guided Focused Ultrasound for Neurological Disorders.World Neurosurg. 2021 Jan;145:581-589. doi: 10.1016/j.wneu.2020.08.052. World Neurosurg. 2021. PMID: 33348524 Review.
Cited by
-
Potential of sonobiopsy as a novel diagnosis tool for brain cancer.Mol Ther Oncol. 2024 Jun 24;32(3):200840. doi: 10.1016/j.omton.2024.200840. eCollection 2024 Sep 19. Mol Ther Oncol. 2024. PMID: 39077551 Free PMC article. Review.
-
Advances in Immunotherapy for the Treatment of Adult Glioblastoma: Overcoming Chemical and Physical Barriers.Cancers (Basel). 2022 Mar 23;14(7):1627. doi: 10.3390/cancers14071627. Cancers (Basel). 2022. PMID: 35406398 Free PMC article. Review.
-
Comparison of Sonication Patterns and Microbubble Administration Strategies for Focused Ultrasound-Mediated Large-Volume Drug Delivery.IEEE Trans Biomed Eng. 2022 Nov;69(11):3449-3459. doi: 10.1109/TBME.2022.3170832. Epub 2022 Oct 19. IEEE Trans Biomed Eng. 2022. PMID: 35476579 Free PMC article.
-
Theranostic Strategy of Focused Ultrasound Induced Blood-Brain Barrier Opening for CNS Disease Treatment.Front Pharmacol. 2019 Feb 7;10:86. doi: 10.3389/fphar.2019.00086. eCollection 2019. Front Pharmacol. 2019. PMID: 30792657 Free PMC article. Review.
-
Advances in magnetic resonance imaging contrast agents for glioblastoma-targeting theranostics.Regen Biomater. 2021 Nov 12;8(6):rbab062. doi: 10.1093/rb/rbab062. eCollection 2021 Dec. Regen Biomater. 2021. PMID: 34868634 Free PMC article. Review.
References
-
- Pardridge WM. Drug and gene delivery to the brain: the vascular route. Neuron 2002;36:555–58 - PubMed
-
- Hynynen K, McDannold N, Sheikov NA, et al. . Local and reversible blood-brain barrier disruption by noninvasive focused ultrasound at frequencies suitable for trans-skull sonications. Neuroimage 2005;24:12–20 - PubMed
-
- Hynynen K, McDannold N, Vykhodtseva N, et al. . Noninvasive MR imaging-guided focal opening of the blood-brain barrier in rabbits. Radiology 2001;220:640–46 - PubMed
Publication types
MeSH terms
LinkOut - more resources
Full Text Sources
Other Literature Sources
Medical