. 2012 Jul;135(Pt 7):2058-73.
doi: 10.1093/brain/aws133. Epub 2012 Jun 19.

Alterations in axonal transport motor proteins in sporadic and experimental Parkinson's disease

Affiliations

Alterations in axonal transport motor proteins in sporadic and experimental Parkinson's disease

Yaping Chu et al. Brain. 2012 Jul.

Abstract

The progressive loss of the nigrostriatal pathway is a distinguishing feature of Parkinson's disease. As terminal field loss seems to precede cell body loss, we tested whether alterations of axonal transport motor proteins would be early features in Parkinson's disease. There was a decline in axonal transport motor proteins in sporadic Parkinson's disease that preceded other well-known nigral cell-related pathology such as phenotypic downregulation of dopamine. Reductions in conventional kinesin levels precede the alterations in dopaminergic phenotypic markers (tyrosine hydroxylase) in the early stages of Parkinson's disease. This reduction was significantly greater in nigral neurons containing α-synuclein inclusions. Unlike conventional kinesin, reductions in the levels of the cytoplasmic dynein light chain Tctex type 3 subunit were only observed at late Parkinson's disease stages. Reductions in levels of conventional kinesin and cytoplasmic dynein subunits were recapitulated in a rat genetic Parkinson's disease model based on over-expression of human mutant α-synuclein (A30P). Together, our data suggest that α-synuclein aggregation is a key feature associated with reductions of axonal transport motor proteins in Parkinson's disease and support the hypothesis that dopaminergic neurodegeneration following a 'dying-back' pattern involving axonal transport disruption.


Figures
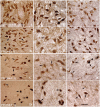
Figure 1
Figure 1
Sections through the mid-substantia nigra show immunoreactivity patterns of KHC (A–D), KLC1 (E–H) and DYNLT3 (I–L) in age-matched controls (A, E and I), Hoehn and Yahr (H&Y) stage 1 Parkinson’s disease (PD; B, F and J), Hoehn and Yahr stage 3 Parkinson’s disease (C, G and K) and Hoehn and Yahr stage 5 Parkinson’s disease (D, H and L) cases. In age-matched controls, every neuromelanin-laden nigral neuron displayed intense KHC and KLC1 immunoreactivities in the soma and processes (A and E). In contrast, nigral neurons of Hoehn and Yahr stage 1 Parkinson’s disease cases display much lighter KHC- and KLC1-immunoreactive levels in neuronal somas, being hardly detected in some cells (arrows; B and F). KHC-labelling processes were severely reduced even when many neuromelanin-laden neurons remain present (B and F), compared with age-matched control (A and E). In Hoehn and Yahr stages 3 and 5 Parkinson’s disease cases, most of remaining neuromelanin-laden neurons showed no detectable KHC and KLC1 labelling (arrows; C, D, G and H). However, non-neuromelanin-laden cells exhibited strong KHC immunoreactivity in the soma and processes (arrowheads; C and D). DYNLT3 immunoreactivity extent and intensity were not obviously decreased in Hoehn and Yahr stage 1 Parkinson’s disease (J) but severely declined in Hoehn and Yahr 3 (K) and Hoehn and Yahr 5 (L) compared with age-matched controls (I). Some remaining neuromelanin-laden neurons exhibited no detectable DYNLT3 (arrows; K and L) but non-neuromelanin-laden neuron appeared DYNLT3-labelling soma and processes (arrowheads; K and L). Scale bar = 70 µm (applies to all).
Figure 2
Figure 2
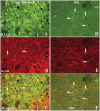
Confocal microscopy images of substantia nigra from age-matched control [A(i–iii)], Hoehn and Yahr (H&Y) stage 1 Parkinson’s disease (PD) [B(i–iii)] and H&Y stage 4 Parkinson’s disease [C(i–iii)] show immunostaining patterns for KHC [green; A(i), B(i) and C(i)], tyrosine hydroxylase [TH; red; A(ii), B(ii) and C(ii)] and co-localization of KHC and tyrosine hydroxylase [merged; A(iii), B(iii) and C(iii)]. The extent and intensity of tyrosine hydroxylase immunoreactivity in both nigral neuronal soma and processes were similar between Hoehn and Yahr stage 1 Parkinson’s disease [B(ii)] and age-matched control [A(ii)]. However, KHC immunofluorescence intensity [arrows; B(i and iii)] was markedly reduced in tyrosine hydroxylase-immunoreactive neurons [arrows; B(ii)] of Hoehn and Yahr stage 1 Parkinson’s disease cases. In Hoehn and Yahr stage 4 Parkinson’s disease, both tyrosine hydroxylase and KHC immunoreactivities were reduced in remaining neuromelanin-laden nigral neurons. Non-tyrosine hydroxylase-immunoreactive cells [arrowheads; C(i and iii)] exhibited intensive KHC-immunoreactive in neuronal soma and processes. Scale bar = 160 µm (applies to all).
Figure 3
Figure 3
Confocal microscopy images of substantia nigra from age-matched control [A(i–iii)], Hoehn and Yahr (H&Y) stage 1 Parkinson’s disease (PD) [B(i–iii)] and Hoehn and Yahr stage 4 Parkinson’s disease [C(i–iii)] illustrating immunostaining for DYNLT3 [green; A(i), B(i) and C(i)], tyrosine hydroxylase [TH; red; A(ii), B(ii) and C(ii)] and co-localization of DYNLT3 and tyrosine hydroxylase [merged; A(iii), B(iii) and C(iii)]. Every tyrosine hydroxylase-immunoreactive neuron exhibited DYNLT3 immunostaining in neuronal soma and processes in age-matched control [A(iii)]. In Hoehn and Yahr stage 1 Parkinson’s disease cases, most tyrosine hydroxylase-immunoreactive nigral neurons exhibited DYNLT3 labelling in both soma and processes [arrows; B(i–iii)], whereas fewer neurons exhibited light DYNLT3 staining [arrowheads; B(i–iii)]. DYNLT3 immunofluorescence intensity was markedly reduced in tyrosine hydroxylase-immunoreactive neurons [arrowheads; C(i and iii)], but intensive DYNLT3 staining was observed in non-tyrosine hydroxylase-immunoreactive cells [arrow; C(i and iii)] in Hoehn and Yahr stage 4 Parkinson’s disease. Scale bar = 120 µm (applies to all).
Figure 4
Figure 4
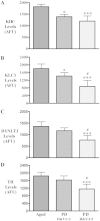
Histograms showing optical density values for KHC (A), KLC1 (B), DYNLT3 (C) and tyrosine hydroxylase (TH; D) fluorescent intensity within nigral neurons of the age-matched controls (aged; n = 9), Hoehn and Yahr stages 1–2 Parkinson’s disease (PD; n = 6) and Hoehn and Yahr stages 3–5 Parkinson’s disease (n = 10). Optical density values for KHC and KLC1, but not DYNLT3 and tyrosine hydroxylase, were significantly reduced in Hoehn and Yahr stages 1–2 Parkinson’s disease compared with age-matched controls. In Hoehn and Yahr stages 3–5 Parkinson’s disease, optical densities for KHC, KLC1, DYNLT3 and tyrosine hydroxylase were all significantly decreased relative to age-matched controls. [***P < 0.001, *P < 0.05 compared with age-matched controls; #P < 0.05 compared with Parkinson’s disease (Hoehn and Yahr 1–2)]. Data are mean ± SD. AFU = arbitrary fluorescence units.
Figure 5
Figure 5
Confocal microscopic images of substantia nigra from age-matched control (A–C) and Hoehn and Yahr stage 3 Parkinson’s disease (PD) (D–F) illustrating immunostaining for KLC1 (green; A and D), α-synuclein (α-syn; red; B and E) and co-localization of KLC1 and α-synuclein (merged; C and F). Note that KLC1 immunofluorescence intensity was extensively reduced in both nigral neurons with (arrows, D–F) or without (arrowheads, D–F) α-synuclein inclusions, relative to age-matched controls (B and C). Nigral neurons labelled with cytoplasmic α-synuclein (no inclusion; arrows, B) in age-matched controls exhibited intensive KLC1 labelling that was similar in intensity to that of neurons without α-synuclein-immunoreactive cytoplasm. Scale bar = 80 µm (applies to all).
Figure 6
Figure 6
Confocal microscopic images of putamen from age-matched control (A–C) and Hoehn and Yahr stage 3 Parkinson’s disease (PD) (D–I) illustrating fibres labelled with tyrosine hydroxylase (TH; green; A and D), KHC (green; G), serine129-phosphorylated α-synuclein (s-129; red; B, E and H) and co-localization of tyrosine hydroxylase with s-129 (merged; C and F) and KHC with s-129 (merged; I). Note that processes featuring s-129 immunoreactivity (E and F) displayed light tyrosine hydroxylase labelling and swollen varicosities (arrows; D–F) compared with age-matched controls (A and C). Interestingly, there was no detectable KHC (arrowheads in I) in fibres filled with phosphorylated Ser-129 (arrowheads; H and I). Conversely, fibres stained with KHC (arrows; G and I) did not display detectable s-129 immunoreactivity. Scale bar = 20 µm (applies to all).
Figure 7
Figure 7
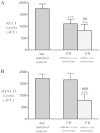
Histograms showing optical density values of KLC1 (A) and DYNLT3 (B) immunofluorescence intensity in nigral neurons with or without α-synuclein inclusions in both sporadic Parkinson’s disease (PD; n = 10) and age-matched control (n = 9) groups. Optical densities of KLC1 immunofluorescence intensity were significantly reduced in Parkinson’s disease neurons relative to age-matched controls, regardless of α-synuclein immunoreactivity levels, but neurons with α-synuclein inclusions displayed greater decreases of optical density of KLC1 immunofluorescence. The optical density of DYNLT3 immunofluorescence intensity was significantly reduced only in neurons with α-synuclein inclusions (B). (***P < 0.001; compared with age-matched controls; ###P < 0.001; ##P < 0.05 related to neurons without α-synuclein inclusion in Parkinson’s disease). Data are means ± SD. AFU = arbitrary fluorescence units.
Figure 8
Figure 8
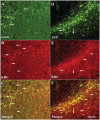
Laser confocal microscopy images of substantia nigra illustrating immunoreactivities for human α-synuclein (α-syn; green; A), KHC (red; B) and merged (C) from rats with targeted expression of human mutant (A30P) α-synuclein and green fluorescence protein (GFP; green; D), KHC (red; E) and merged (F) from rat with target expression GFP. Note that the KHC immunofluorescent intensity was diminished by targeting expression of α-synuclein. KHC immunoreactivity was observed in the cells without α-synuclein immunoreactivity (arrowheads; B and C) but not in cells with α-synuclein immunoreactivity (arrows; A–C). In contrast, GFP-positive neurons displayed intensive KHC immunostaining (arrows; E and F) similar to the GFP-negative cells (arrowheads). Scale bar = 110 µm (applies to all).
Figure 9
Figure 9
Confocal microscopic images of putamen from rats with targeted expression of either green fluorescent protein (AAV-GFP; A–C) or human mutant (A30P) α-synuclein (AAV-α-syn; D–I) illustrating fibres labelled with tyrosine hydroxylase (TH; red; A and D), KHC (green; G), phosphorylated Ser-129 α-synuclein (s-129; green; B and E, red; H) and co-localization of s-129 with tyrosine hydroxylase (merge; C and F) or s-129 with KHC (merged; I). Note that axonal fibres filled with phosphorylated Ser-129 (arrows; E) displayed swollen varicosities (D and F; arrows). Interestingly, KHC was undetectable in axonal fibres filled with phosphorylated Ser-129 (G–I; arrowheads) but abundant in fibres where phosphorylated Ser-129 labelling was absent (G and I; arrows). There was no significant immunoreactivity for phosphorylated Ser-129 in rats with targeted expression of GFP (B). Scale bar = 20 µm (applies to all).
Figure 10
Figure 10
Histogram showing optical density values of KHC (A) and DYNLT3 (B) immunofluorescence intensity within nigral neurons from uninjected rats (control; n = 8), rats with targeted expression of GFP (n = 8) and rats with targeted expression of human mutant (A30P) α-synuclein (α-syn; n = 8). In rats with targeted expression of human A30P α-syn, optical density values of KHC (A) and DYNLT3 (B) immunofluorescence intensity were significantly reduced in neurons with α-synuclein (α-syn+) and without α-synuclein (α-syn), relative to control rats. In rats with targeted expression of human GFP, optical densities of KHC and DYNLT3 were unchanged in both GFP-positive (GFP+) and -negative (GFP) neurons, compared with control rats. (***P < 0.001; compared with controls; #P < 0.05 related to neurons without α-synuclein). Data are means ± SD. AFU = arbitrary fluorescence units.

Similar articles

Cited by

References

    1. Chu Y, Kordower JH. Age-associated increases of alpha-synuclein in monkeys and humans are associated with nigrostriatal dopamine depletion: is this the target for Parkinson’s disease? Neurobiol Dis. 2007;25:134–49. - PubMed
    1. Chu Y, Dodiya H, Aebischer P, Olanow CW, Kordower JH. Alterations in lysosomal and proteasomal markers in Parkinson’s disease: relationship to alpha-synuclein inclusions. Neurobiol Dis. 2009;35:385–98. - PubMed
    1. Chu Y, Le W, Kompoliti K, Jankovic J, Mufson EJ, Kordower JH. Nurr1 in Parkinson’s disease and related disorders. J Comp Neurol. 2006;494:495–514. - PMC - PubMed
    1. Chu Y, Mickiewicz AL, Kordower JH. α-Synuclein aggregation reduces nigral myocyte enhancer factor-2D in idiopathic and experimental Parkinson’s disease. Neurobiol Dis. 2011;41:71–82. - PubMed
    1. Chung CY, Koprich JB, Siddiqi H, Isacson O. Dynamic changes in presynaptic and axonal transport proteins combined with striatal neuroinflammation precede dopaminergic neuronal loss in a rat model of AAV alpha-synucleinopathy. J Neurosci. 2009;29:3365–73. - PMC - PubMed

Publication types

MeSH terms