

Targeted depletion of TDP-43 expression in the spinal cord motor neurons leads to the development of amyotrophic lateral sclerosis-like phenotypes in mice
- PMID: 22718760
- PMCID: PMC3431639
- DOI: 10.1074/jbc.M112.359000
Targeted depletion of TDP-43 expression in the spinal cord motor neurons leads to the development of amyotrophic lateral sclerosis-like phenotypes in mice
Abstract
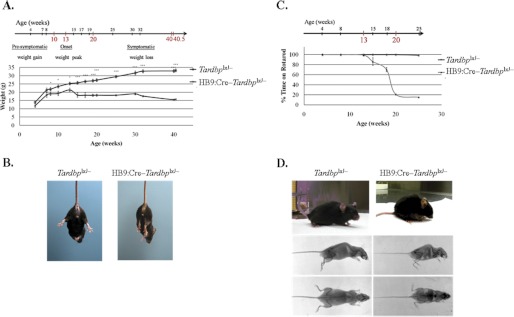
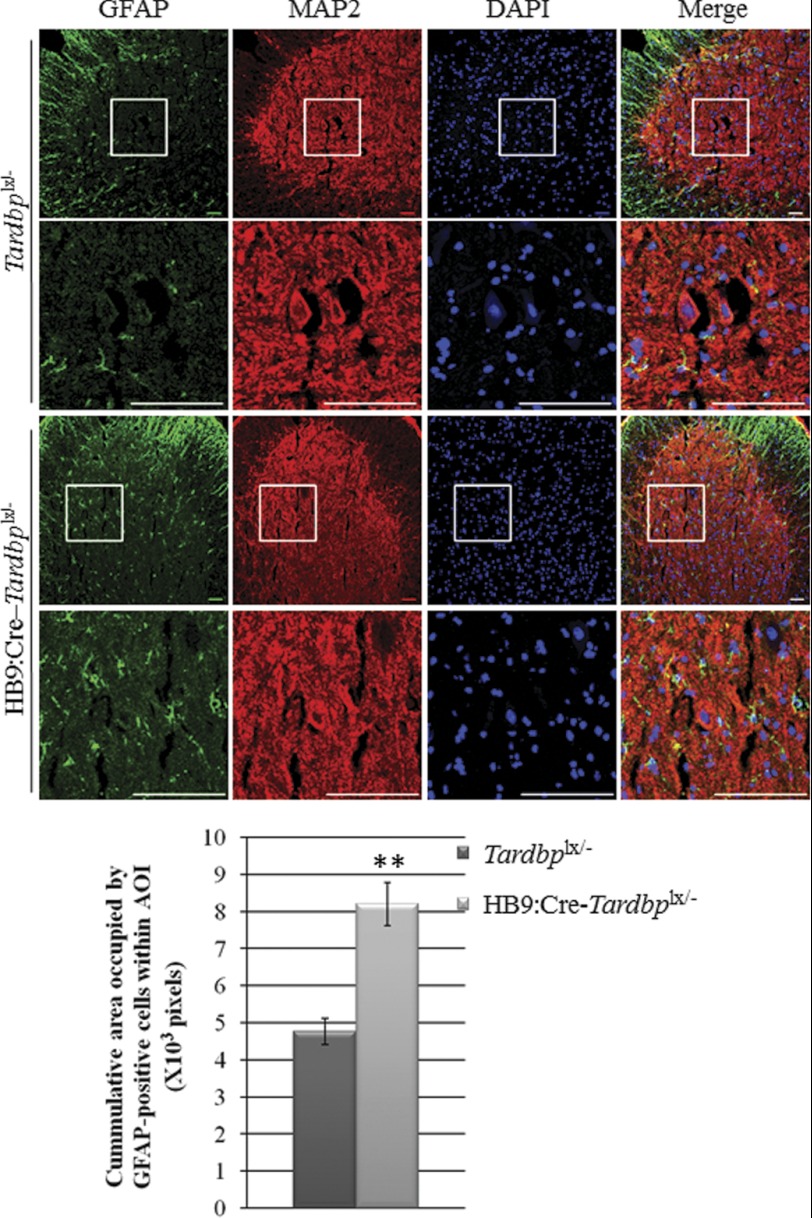
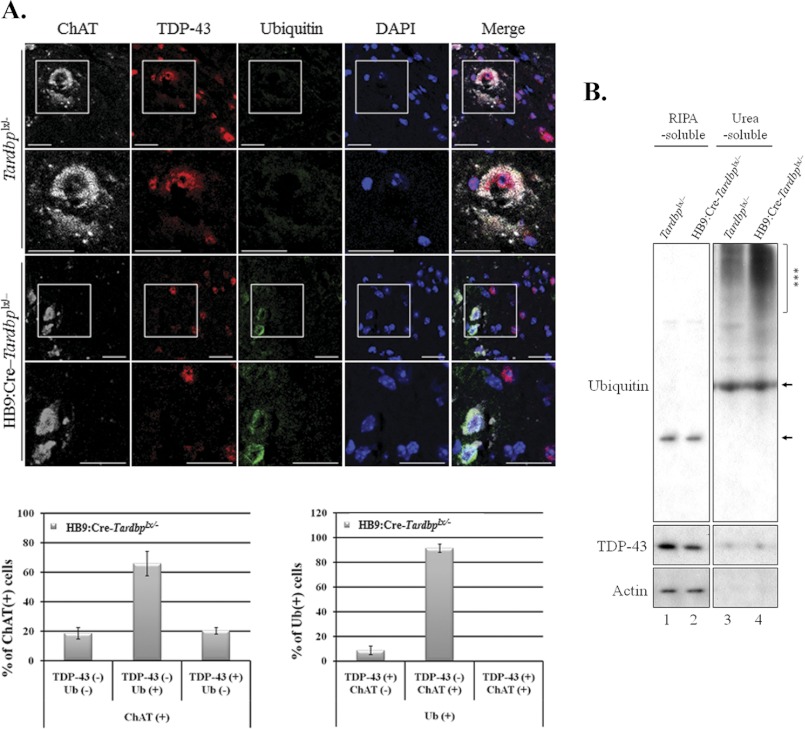
ALS, or amyotrophic lateral sclerosis, is a progressive and fatal motor neuron disease with no effective medicine. Importantly, the majority of the ALS cases are with TDP-43 proteinopathies characterized with TDP-43-positive, ubiquitin-positive inclusions (UBIs) in the cytosol. However, the role of the mismetabolism of TDP-43 in the pathogenesis of ALS with TDP-43 proteinopathies is unclear. Using the conditional mouse gene targeting approach, we show that mice with inactivation of the Tardbp gene in the spinal cord motor neurons (HB9:Cre-Tardbp(lx/-)) exhibit progressive and male-dominant development of ALS-related phenotypes including kyphosis, motor dysfunctions, muscle weakness/atrophy, motor neuron loss, and astrocytosis in the spinal cord. Significantly, ubiquitinated proteins accumulate in the TDP-43-depleted motor neurons of the spinal cords of HB9:Cre-Tardbp(lx/-) mice with the ALS phenotypes. This study not only establishes an important role of TDP-43 in the long term survival and functioning of the mammalian spinal cord motor neurons, but also establishes that loss of TDP-43 function could be one major cause for neurodegeneration in ALS with TDP-43 proteinopathies.
Figures


Similar articles
-
TDP-43 expression in mouse models of amyotrophic lateral sclerosis and spinal muscular atrophy.BMC Neurosci. 2008 Oct 28;9:104. doi: 10.1186/1471-2202-9-104. BMC Neurosci. 2008. PMID: 18957104 Free PMC article.
-
Increased cytoplasmic TARDBP mRNA in affected spinal motor neurons in ALS caused by abnormal autoregulation of TDP-43.Nucleic Acids Res. 2016 Jul 8;44(12):5820-36. doi: 10.1093/nar/gkw499. Epub 2016 Jun 2. Nucleic Acids Res. 2016. PMID: 27257061 Free PMC article.
-
Review: Prion-like mechanisms of transactive response DNA binding protein of 43 kDa (TDP-43) in amyotrophic lateral sclerosis (ALS).Neuropathol Appl Neurobiol. 2015 Aug;41(5):578-97. doi: 10.1111/nan.12206. Epub 2015 Apr 20. Neuropathol Appl Neurobiol. 2015. PMID: 25487060 Review.
-
TDP-43 redistribution is an early event in sporadic amyotrophic lateral sclerosis.Brain Pathol. 2010 Mar;20(2):351-60. doi: 10.1111/j.1750-3639.2009.00284.x. Epub 2009 Mar 17. Brain Pathol. 2010. PMID: 19338576 Free PMC article.
-
The molecular link between inefficient GluA2 Q/R site-RNA editing and TDP-43 pathology in motor neurons of sporadic amyotrophic lateral sclerosis patients.Brain Res. 2014 Oct 10;1584:28-38. doi: 10.1016/j.brainres.2013.12.011. Epub 2013 Dec 16. Brain Res. 2014. PMID: 24355598 Review.
Cited by
-
TDP-43 transports ribosomal protein mRNA to regulate axonal local translation in neuronal axons.Acta Neuropathol. 2020 Nov;140(5):695-713. doi: 10.1007/s00401-020-02205-y. Epub 2020 Aug 16. Acta Neuropathol. 2020. PMID: 32803350
-
TDP-43 maximizes nerve conduction velocity by repressing a cryptic exon for paranodal junction assembly in Schwann cells.Elife. 2021 Mar 10;10:e64456. doi: 10.7554/eLife.64456. Elife. 2021. PMID: 33689679 Free PMC article.
-
RRM adjacent TARDBP mutations disrupt RNA binding and enhance TDP-43 proteinopathy.Brain. 2019 Dec 1;142(12):3753-3770. doi: 10.1093/brain/awz313. Brain. 2019. PMID: 31605140 Free PMC article.
-
Mice with endogenous TDP-43 mutations exhibit gain of splicing function and characteristics of amyotrophic lateral sclerosis.EMBO J. 2018 Jun 1;37(11):e98684. doi: 10.15252/embj.201798684. Epub 2018 May 15. EMBO J. 2018. PMID: 29764981 Free PMC article.
-
To Be or Not To Be…Toxic-Is RNA Association With TDP-43 Complexes Deleterious or Protective in Neurodegeneration?Front Mol Biosci. 2020 Jan 10;6:154. doi: 10.3389/fmolb.2019.00154. eCollection 2019. Front Mol Biosci. 2020. PMID: 31998750 Free PMC article. Review.
References
-
- Mulder D. W. (1982) Clinical limits of amyotrophic lateral sclerosis. Adv. Neurol. 36, 15–22 - PubMed
-
- Pasinelli P., Brown R. H. (2006) Molecular biology of amyotrophic lateral sclerosis. Insights from genetics. Nat. Rev. Neurosci. 7, 710–723 - PubMed
-
- Johnston C. A., Stanton B. R., Turner M. R., Gray R., Blunt A. H., Butt D., Ampong M. A., Shaw C. E., Leigh P. N., Al-Chalabi A. (2006) Amyotrophic lateral sclerosis in an urban setting. A population based study of inner city London. J. Neurol. 253, 1642–1643 - PubMed
-
- Manjaly Z. R., Scott K. M., Abhinav K., Wijesekera L., Ganesalingam J., Goldstein L. H., Janssen A., Dougherty A., Willey E., Stanton B. R., Turner M. R., Ampong M. A., Sakel M., Orrell R. W., Howard R., Shaw C. E., Leigh P. N., Al-Chalabi A. (2010) The sex ratio in amyotrophic lateral sclerosis. A population based study. Amyotroph. Lateral Scler. 11, 439–442 - PMC - PubMed
Publication types
MeSH terms
Substances
LinkOut - more resources
Full Text Sources
Other Literature Sources
Medical
Molecular Biology Databases
Miscellaneous
