

Colon cancer molecular subtypes identified by expression profiling and associated to stroma, mucinous type and different clinical behavior
- PMID: 22712570
- PMCID: PMC3571914
- DOI: 10.1186/1471-2407-12-260
Colon cancer molecular subtypes identified by expression profiling and associated to stroma, mucinous type and different clinical behavior
Abstract
Background: Colon cancer patients with the same stage show diverse clinical behavior due to tumor heterogeneity. We aimed to discover distinct classes of tumors based on microarray expression patterns, to analyze whether the molecular classification correlated with the histopathological stages or other clinical parameters and to study differences in the survival.
Methods: Hierarchical clustering was performed for class discovery in 88 colon tumors (stages I to IV). Pathways analysis and correlations between clinical parameters and our classification were analyzed. Tumor subtypes were validated using an external set of 78 patients. A 167 gene signature associated to the main subtype was generated using the 3-Nearest-Neighbor method. Coincidences with other prognostic predictors were assesed.
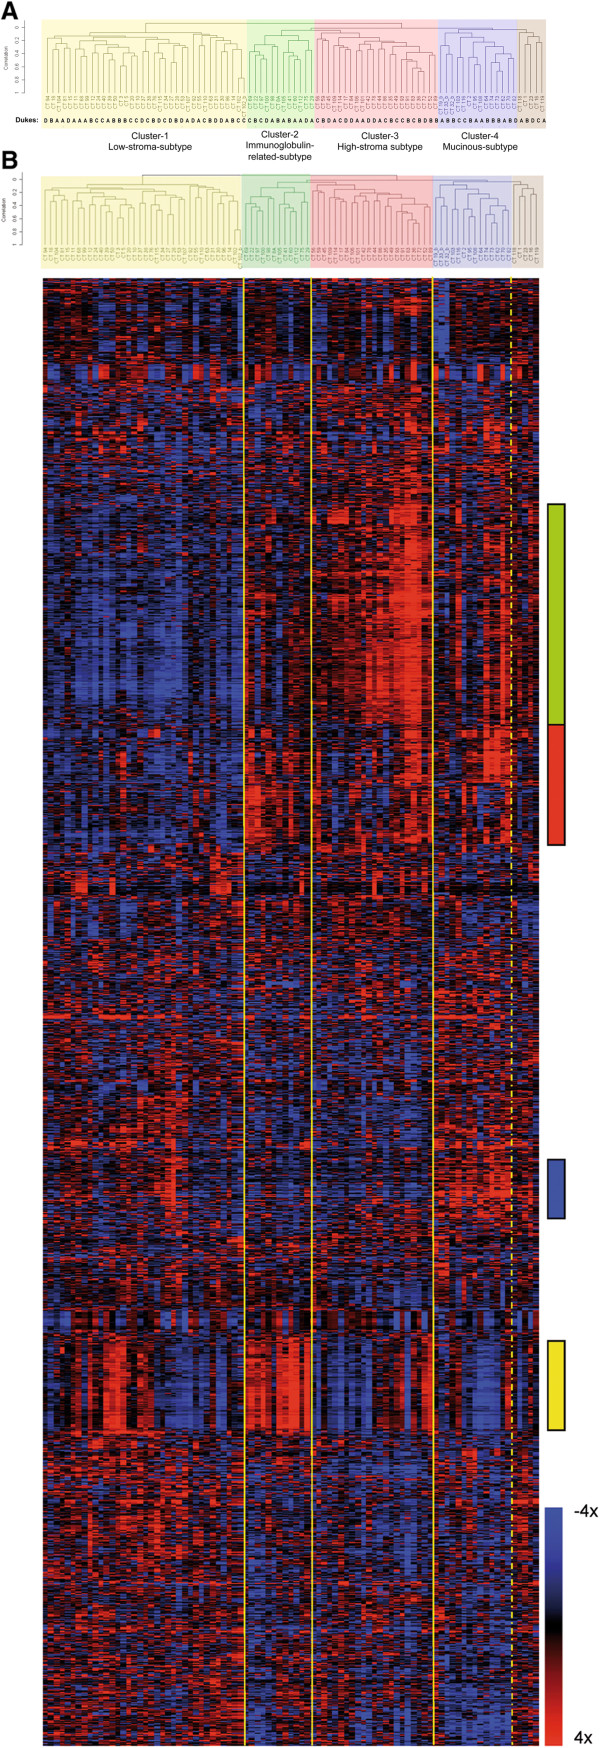
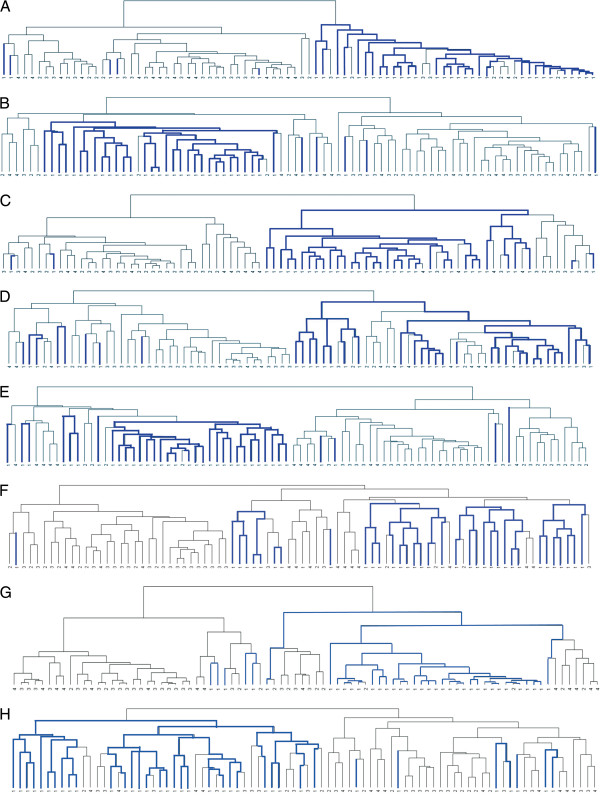
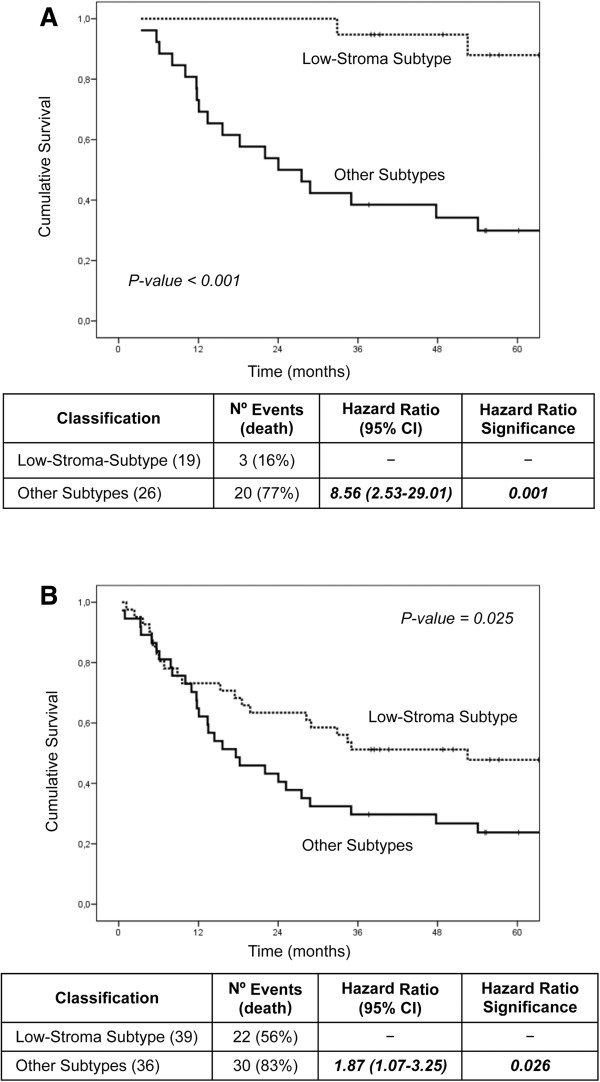
Results: Hierarchical clustering identified four robust tumor subtypes with biologically and clinically distinct behavior. Stromal components (p < 0.001), nuclear β-catenin (p = 0.021), mucinous histology (p = 0.001), microsatellite-instability (p = 0.039) and BRAF mutations (p < 0.001) were associated to this classification but it was independent of Dukes stages (p = 0.646). Molecular subtypes were established from stage I. High-stroma-subtype showed increased levels of genes and altered pathways distinctive of tumour-associated-stroma and components of the extracellular matrix in contrast to Low-stroma-subtype. Mucinous-subtype was reflected by the increased expression of trefoil factors and mucins as well as by a higher proportion of MSI and BRAF mutations. Tumor subtypes were validated using an external set of 78 patients. A 167 gene signature associated to the Low-stroma-subtype distinguished low risk patients from high risk patients in the external cohort (Dukes B and C:HR = 8.56(2.53-29.01); Dukes B,C and D:HR = 1.87(1.07-3.25)). Eight different reported survival gene signatures segregated our tumors into two groups the Low-stroma-subtype and the other tumor subtypes.
Conclusions: We have identified novel molecular subtypes in colon cancer with distinct biological and clinical behavior that are established from the initiation of the tumor. Tumor microenvironment is important for the classification and for the malignant power of the tumor. Differential gene sets and biological pathways characterize each tumor subtype reflecting underlying mechanisms of carcinogenesis that may be used for the selection of targeted therapeutic procedures. This classification may contribute to an improvement in the management of the patients with CRC and to a more comprehensive prognosis.
Figures

Similar articles
-
Gene expression classification of colon cancer into molecular subtypes: characterization, validation, and prognostic value.PLoS Med. 2013;10(5):e1001453. doi: 10.1371/journal.pmed.1001453. Epub 2013 May 21. PLoS Med. 2013. PMID: 23700391 Free PMC article.
-
Phenotypic subtypes predict outcomes in colorectal cancer.Acta Oncol. 2023 Mar;62(3):245-252. doi: 10.1080/0284186X.2023.2183779. Epub 2023 Mar 3. Acta Oncol. 2023. PMID: 36867078
-
Pathogenesis of colloid (pure mucinous) carcinoma of exocrine organs: Coupling of gel-forming mucin (MUC2) production with altered cell polarity and abnormal cell-stroma interaction may be the key factor in the morphogenesis and indolent behavior of colloid carcinoma in the breast and pancreas.Am J Surg Pathol. 2003 May;27(5):571-8. doi: 10.1097/00000478-200305000-00002. Am J Surg Pathol. 2003. PMID: 12717243
-
Mucinous subtype as prognostic factor in colorectal cancer: a systematic review and meta-analysis.J Clin Pathol. 2012 May;65(5):381-8. doi: 10.1136/jclinpath-2011-200340. Epub 2012 Jan 18. J Clin Pathol. 2012. PMID: 22259177 Review.
-
Mucinous differentiation in colorectal cancer: molecular, histological and clinical aspects.Acta Chir Belg. 2013 Nov-Dec;113(6):385-90. Acta Chir Belg. 2013. PMID: 24494463 Review.
Cited by
-
The autocrine loop of ALK receptor and ALKAL2 ligand is an actionable target in consensus molecular subtype 1 colon cancer.J Exp Clin Cancer Res. 2022 Mar 29;41(1):113. doi: 10.1186/s13046-022-02309-1. J Exp Clin Cancer Res. 2022. PMID: 35351152 Free PMC article.
-
SOD3 improves the tumor response to chemotherapy by stabilizing endothelial HIF-2α.Nat Commun. 2018 Feb 8;9(1):575. doi: 10.1038/s41467-018-03079-1. Nat Commun. 2018. PMID: 29422508 Free PMC article.
-
Impact of Cuproptosis-related markers on clinical status, tumor immune microenvironment and immunotherapy in colorectal cancer: A multi-omic analysis.Comput Struct Biotechnol J. 2023 Jun 13;21:3383-3403. doi: 10.1016/j.csbj.2023.06.011. eCollection 2023. Comput Struct Biotechnol J. 2023. PMID: 37389187 Free PMC article.
-
Consensus molecular subtypes and the evolution of precision medicine in colorectal cancer.Nat Rev Cancer. 2017 Feb;17(2):79-92. doi: 10.1038/nrc.2016.126. Epub 2017 Jan 4. Nat Rev Cancer. 2017. PMID: 28050011 Review.
-
Colorectal cancer intrinsic subtypes predict chemotherapy benefit, deficient mismatch repair and epithelial-to-mesenchymal transition.Int J Cancer. 2014 Feb 1;134(3):552-62. doi: 10.1002/ijc.28387. Epub 2013 Sep 13. Int J Cancer. 2014. PMID: 23852808 Free PMC article.
References
-
- Diaz-Rubio E, Tabernero J, Gomez-Espana A, Massuti B, Sastre J, Chaves M, Abad A, Carrato A, Queralt B, Reina JJ. et al.Phase III study of capecitabine plus oxaliplatin compared with continuous-infusion fluorouracil plus oxaliplatin as first-line therapy in metastatic colorectal cancer: final report of the Spanish Cooperative Group for the Treatment of Digestive Tumors Trial. J Clin Oncol. 2007;25(27):4224–4230. doi: 10.1200/JCO.2006.09.8467. - DOI - PubMed
-
- Lin YH, Friederichs J, Black MA, Mages J, Rosenberg R, Guilford PJ, Phillips V, Thompson-Fawcett M, Kasabov N, Toro T. et al.Multiple gene expression classifiers from different array platforms predict poor prognosis of colorectal cancer. Clin Cancer Res. 2007;13(2 Pt 1):498–507. - PubMed
Publication types
MeSH terms
Substances
LinkOut - more resources
Full Text Sources
Other Literature Sources
Research Materials
