. 2012 Dec;22(12):2529-40.
doi: 10.1101/gr.140475.112. Epub 2012 Jun 15.

Long noncoding RNAs in C. elegans

Affiliations

Long noncoding RNAs in C. elegans

Jin-Wu Nam et al. Genome Res. 2012 Dec.

Abstract

Thousands of long noncoding RNAs (lncRNAs) have been found in vertebrate animals, a few of which have known biological roles. To better understand the genomics and features of lncRNAs in invertebrates, we used available RNA-seq, poly(A)-site, and ribosome-mapping data to identify lncRNAs of Caenorhabditis elegans. We found 170 long intervening ncRNAs (lincRNAs), which had single- or multiexonic structures that did not overlap protein-coding transcripts, and about sixty antisense lncRNAs (ancRNAs), which were complementary to protein-coding transcripts. Compared to protein-coding genes, the lncRNA genes tended to be expressed in a stage-dependent manner. Approximately 25% of the newly identified lincRNAs showed little signal for sequence conservation and mapped antisense to clusters of endogenous siRNAs, as would be expected if they serve as templates and targets for these siRNAs. The other 75% tended to be more conserved and included lincRNAs with intriguing expression and sequence features associating them with processes such as dauer formation, male identity, sperm formation, and interaction with sperm-specific mRNAs. Our study provides a glimpse into the lncRNA content of a nonvertebrate animal and a resource for future studies of lncRNA function.


Figures

Figure 1.
Figure 1.
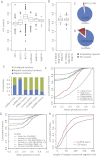
Identification of C. elegans lncRNA genes. (A) Pipeline for de novo gene annotation and identification of lncRNAs. See main text and Supplemental Methods for details. (B) Venn diagram showing the overlap between the results of de novo gene annotation and modENCODE gene annotation. (C) Venn diagram showing the overlap of candidate lincRNA loci that passed the indicated filters. (D) Venn diagram showing the overlap of candidate ancRNA loci that passed the indicated filters. (E) The fraction of potential lncRNAs that had 3P-seq supported poly(A)-sites. Shown are the numbers of genes, with the number of splicing/3′ UTR isoforms in parentheses. (F) Diagram of trans-splicing by splice leader 1 (SL1). A chimeric read spanning the SL1-exon junction is diagnostic of trans-splicing. (G) Number of chimeric reads and unique junctions mapping to the upstream regions of lincRNA and protein-coding genes. For protein-coding genes, 100 cohorts, each selected to match the set of lincRNA genes with respect to gene number and expression levels, were used to estimate the 90% confidence interval (error bar).
Figure 2.
Figure 2.
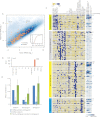
Endo-siRNAs mapping antisense to lincRNAs. (A) Abundance of endo-siRNAs mapping antisense to 73 lincRNAs with mean RPKM ≥ 1. The key indicates the log-scaled RPKM values (endo-siRNA reads per kilobase per million genomic mapping reads). The lincRNAs were sorted by the mean RPKM values (averaging RPKMs calculated from all 35 RNA-seq samples). The data used to make this heat map are presented in Supplemental Table S6. (B) Improved annotations of loci corresponding to the top 30 22G-RNA clusters from the adult stage. (Left panel) Fractions of 22G-RNAs mapping to the antisense strand (red), sense strand (green), and intergenic or intronic regions (gray) of protein-coding genes annotated in ce6. (Right panel) Fractions of 22G-RNAs mapping to the indicated transcripts of the de novo gene annotation, highlighting those mapping antisense to new transcripts (orange). Clusters mapping antisense to either lincRNAs or newly annotated transcripts that satisfied only two of the three lincRNA filtering criteria are indicated (blue and gray asterisks, respectively) as are those mapping antisense to pseudogenes (T09F5.12, Y39E4B.14, and C47G2.6). (C) Improved annotations of loci corresponding to the top 30 26G-RNA clusters from the embryo stage; otherwise, as in B.
Figure 3.
Figure 3.
lincRNA sequence composition and conservation. (A) A/U content of lincRNAs and ancRNAs, compared to that of mRNA 5′ UTRs, 3′ UTRs, and coding regions, and that of intergenic regions. Box and whisker plots indicate the median, interquartile range (IQR) between 25th and 75th percentiles (box), and 1.5 IQR (whisker). (B) A/U content of lincRNAs antisense to abundant 22G-RNAs (≥5 RPKM) and those antisense to less abundant or no 22G-RNAs (<5 RPKM); otherwise, as in A. (C) The fraction of mRNAs containing annotated repeat elements. (D) The fraction of lincRNAs containing annotated repeat elements. (E) Fraction of residues aligned in multiple-genome alignments for the indicated mRNA and lincRNA regions. Control exons were generated by random selection of a length-matched region from intergenic space of the same chromosome; within this control region, exons were assigned to the same relative positions as in the authentic lincRNA locus. Annotated repeats were removed from the control exons, lincRNA exons, and lincRNA introns prior to analysis. (F) Conservation of lincRNA and mRNA introns and exons. Shown are cumulative distributions of mean phastCons scores derived from the six-way whole-genome alignments (Siepel et al. 2005). Control exons were as in E. (G) Relationship between mapping to 22G-RNAs and sequence conservation. lincRNAs were assigned to three groups based on the abundance (RPKM) of antisense-mapping 22G-RNAs. Shown are cumulative distributions of mean phastCons scores (Siepel et al. 2005) for each group. (H) Lengths of conserved regions within exons. For each exon that had an average phastCons score > 0, the maximum length of regions exceeding a phastCons score of 0.5 was measured. For CDS exons, 1000 length-matched exons were randomly selected from coding regions.
Figure 4.
Figure 4.
Developmental- and stage-specific expression of lincRNAs. (A) Differential expression of lincRNAs. For each lincRNA and mRNA, the maximum RPKM value from 10 distinct developmental stages (Supplemental Table S1B) is plotted relative to the mean value for the remaining nine stages. If the mean value was 0, a small value (0.1) was added to avoid the log 0 value error. For stages with multiple samples, the median value of RPKMs was used. The inset shows cumulative distributions of log2-scaled ratios of maximum and mean RPKMs for lincRNA and mRNAs. (B) Dauer-specific expression of linc-3. Plotted are the RPKM values of linc-3 in 10 distinct stages. (C) Four large lincRNA expression clusters over 35 different developmental stages/conditions (top key). Colored asterisks indicate lincRNA genes within 10 kb of each other. Within each cluster, lincRNAs are sorted based on their expression level (mean RPKM), with the expression level indicated at the far right. The five columns on the right show the abundance (RPKM) of endo-siRNAs mapping antisense to each lincRNA (bottom key). (D) Correlation between lincRNA expression and that of their closest protein-coding gene. Shown is the average correlation for pairs with the indicated relative orientations (tandem, convergent, and divergent), considering only pairs within 1 kb of each other. As a control, mean correlations were also calculated for number-matched cohorts of random pairs of lincRNA and protein-coding genes. For comparison, mean correlations were calculated for number-matched cohorts of protein-coding gene pairs. For both the controls and comparisons, the average correlation of 1000 cohorts is reported for each orientation, with error bars showing the 95% confident interval.
Figure 5.
Figure 5.
Long-range expression correlations involving the dauer-specific linc-3. (A) Expression of genes located within a 200-kb region centered on linc-3. The RNA-seq tracks illustrate that linc-3 and many other genes in the region were expressed higher in dauer entry and dauer stages compared with dauer exit and L3 stages. (Inset) Gene structure of linc-3 and its very high expression during dauer entry, with a read maximum exceeding that of any other gene in the region. The gene models are color-coded based on the correlation between their expression and that of linc-3 (key). (B) The expression profile of linc-3 across 35 different developmental stages/conditions. (C) The expression profile of the 59 genes within 200 kb of the linc-3 gene, visualized by plotting the mean z scores for each stage/condition. The error bars indicate standard deviation.
Figure 6.
Figure 6.
A short conserved segment of linc-55 complementary to members of the major sperm protein (MSP) family. Conservation and alignment tracks show an ∼70-nt segment conserved in four additional sequenced species. This segment has extensive complementarity to 37 members of the major sperm protein family (E-value < 10−5), including some hypothetical genes (e.g., ZK1248.17).

Similar articles

Cited by

References

    1. Ambros V, Lee RC, Lavanway A, Williams PT, Jewell D 2003. MicroRNAs and other tiny endogenous RNAs in C. elegans. Curr Biol 13: 807–818 - PubMed
    1. Batista PJ, Ruby JG, Claycomb JM, Chiang R, Fahlgren N, Kasschau KD, Chaves DA, Gu W, Vasale JJ, Duan S, et al. 2008. PRG-1 and 21U-RNAs interact to form the piRNA complex required for fertility in C. elegans. Mol Cell 31: 67–78 - PMC - PubMed
    1. Birney E, Stamatoyannopoulos JA, Dutta A, Guigo R, Gingeras TR, Margulies EH, Weng Z, Snyder M, Dermitzakis ET, Thurman RE, et al. 2007. Identification and analysis of functional elements in 1% of the human genome by the ENCODE pilot project. Nature 447: 799–816 - PMC - PubMed
    1. Blumenthal T, Gleason KS 2003. Caenorhabditis elegans operons: Form and function. Nat Rev Genet 4: 112–120 - PubMed
    1. Blumenthal T, Steward K 1997. RNA processing and gene structure. In C. elegans II (ed. DL Riddle et al.), pp. 117–145. Cold Spring Harbor Laboratory Press, Cold Spring Harbor, NY

Publication types