. 2012 Jul;122(7):2499-508.
doi: 10.1172/JCI62970. Epub 2012 Jun 18.

Intravital 2-photon imaging of leukocyte trafficking in beating heart

Affiliations

Intravital 2-photon imaging of leukocyte trafficking in beating heart

Wenjun Li et al. J Clin Invest. 2012 Jul.

Abstract

Two-photon intravital microscopy has substantially broadened our understanding of tissue- and organ-specific differences in the regulation of inflammatory responses. However, little is known about the dynamic regulation of leukocyte recruitment into inflamed heart tissue, largely due to technical difficulties inherent in imaging moving tissue. Here, we report a method for imaging beating murine hearts using intravital 2-photon microscopy. Using this method, we visualized neutrophil trafficking at baseline and during inflammation. Ischemia reperfusion injury induced by transplantation or transient coronary artery ligation led to recruitment of neutrophils to the heart, their extravasation from coronary veins, and infiltration of the myocardium where they formed large clusters. Grafting hearts containing mutant ICAM-1, a ligand important for neutrophil recruitment, reduced the crawling velocities of neutrophils within vessels, and markedly inhibited their extravasation. Similar impairment was seen with the inhibition of Mac-1, a receptor for ICAM-1. Blockade of LFA-1, another ICAM-1 receptor, prevented neutrophil adherence to endothelium and extravasation in heart grafts. As inflammatory responses in the heart are of great relevance to public health, this imaging approach holds promise for studying cardiac-specific mechanisms of leukocyte recruitment and identifying novel therapeutic targets for treating heart disease.


Figures

Figure 1
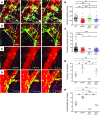
Figure 1. 2P microscopy of neutrophils in explanted heart at steady state and after heterotopic heart transplantation.
(A) Myocardial tissue with resident neutrophils (green cells, white box) and macrophages (green cells, yellow box). Nontargeted Q-dots were injected intravenously 10 minutes before imaging to label the blood vessels (red). Scale bar: 60 μm. (B and C) Zoomed views from panel A showing (B) an intravascular neutrophil (white arrowhead) and (C) a macrophage (yellow arrowhead). These cells can be distinguished by morphology and fluorescence intensity. Scale bar: 10 μm. (D) Time-lapse images of neutrophils in explanted heart tissue after heterotopic cardiac transplantation into B6 LysM-GFP mice. Images are individual frames from a continuous time-lapse recording (Supplemental Video 1). Relative time is displayed in h:min:s. Lower panels are zoomed views from the boxed regions. Neutrophils were found adhering to the endothelium (yellow arrowhead) or crawling along it. Extravascular neutrophils (white arrowheads) formed dynamic clusters (white arrows) over minutes. Scale bars: 60 μm (upper panels); 20 μm (lower panels). Data are representative of at least 3 independent experiments per group.
Figure 2
Figure 2. 2P microscopy of heterotopic heart transplants.
(A) Depiction of an exposed heterotopic transplanted heart in the right cervical region with mouse placed on the base plate of the imaging chamber. (B) A small ring of Vetbond is applied to the bottom of the coverglass portion of the stabilization plate and briefly held against the heart to secure the tissue. The upper plate is adjusted to minimize pressure on the heart. (B, inset) Photograph of in vivo preparation with affixed heart graft indicated by yellow line. (C) Side view of the imaging set up showing the mouse, the upper and bottom chamber plates, and the microscope objective.
Figure 3
Figure 3. Coronary artery imaging in vivo.
(Supplemental Video 2) Video rate images show individual neutrophils (yellow and white arrowheads) moving (yellow and white tracks) in a coronary artery labeled with Q-dots (red). Other neutrophils are visible in nearby capillaries. Relative times are displayed in min:s:ms. Scale bar: 60 μm.
Figure 4
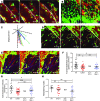
Figure 4. 2P imaging of intravascular neutrophil dynamics in heterotopic heart transplants.
(A, Supplemental Video 3) WT heart graft with extensive neutrophil arrest inside blood vessels (white outline) and intravascular cluster formation (white arrowheads). n = 4 mice. Comparable results were obtained in untreated and isotype control–treated recipients of WT cardiac grafts. (B, Supplemental Video 4) Neutrophil trafficking in ICAM-1–mutant (denoted as ICAM-1) donor hearts (n = 2 mice), (C, Supplemental Video 5) after treatment of recipient mice with anti-LFA 1 (n = 4 mice), and (D, Supplemental Video 6) after treatment with anti-Mac 1 antibodies (n = 4 mice). Scale bars: 60 μm. (E) A comparison of cell-rolling velocities in each group. Rolling velocities were lower in ICAM-1–mutant grafts and anti–Mac-1–treated recipient mice compared with WT mice, while velocities after treatment with anti–LFA-1 were comparable to those in WT. WT, n = 37; ICAM-1–mutant, n = 61; anti–LFA-1, n = 56; anti–Mac-1, n = 47. *P < 0.05; **P < 0.01; ***P < 0.0001. (F) Intraluminal crawling velocities. ICAM-1–mutant grafts, and anti–Mac-1–treated recipients had significantly lower crawling velocities when compared with WT mice. Due to the low number of adherent neutrophils, crawling activity could not be analyzed after blockade of LFA-1. WT, n = 260; ICAM-1–mutant, n = 317; anti–LFA-1, n = NA; anti–Mac-1, n = 481. *P < 0.05; ***P < 0.0001. For parts E and F, symbols represent individual cells, and horizontal bars depict means. (G) Intravascular neutrophil clusters. Cluster frequency increased in ICAM-1–mutant hearts and with anti–Mac-1 antibody treatment and decreased when LFA-1 was blocked. *P < 0.05; **P < 0.01. Symbols represent intravascular neutrophil clusters. (H) Neutrophil cluster size. ICAM-1–mutant grafts had larger neutrophil clusters compared with WT hearts. **P < 0.01; ***P < 0.0001. For G and H, horizontal bars denote means, and error bars denote SEM.
Figure 5
Figure 5. Extravascular neutrophil trafficking.
(A, Supplemental Video 3) Time-lapse images of WT heart grafts showing individual neutrophils extravasating (yellow tracks) and migrating through cardiac tissue with mean speeds of 10.48 ± 4.1 μm/min (n = 4 mice). (B) Large extravascular clusters of neutrophils in the ventricular wall of WT grafts. Individual neutrophils migrate toward dynamic clusters (yellow tracks). (C) Direction of neutrophil displacement in B6 WT hearts after transplantation into syngeneic LysM-GFP mouse (n = 18). (D and E) Time-lapse imaging of neutrophil extravasation in (D, Supplemental Video 4) ICAM-1–mutant grafts (n = 2 mice) and (E, Supplemental Video 5) after Mac-1 blockade of heart transplant recipients (n = 4 mice). Scale bars: 60 μm. (F) Speed of transendothelial migration from luminal surface to tissue parenchyma (WT, n = 28; ICAM-1–mutant, n = 32; anti–LFA-1, n = NA; anti–Mac-1, n = 27; *P < 0.05; **P < 0.01), (G) velocity (WT, n = 18; ICAM-1–mutant, n = 31; anti–LFA-1, n = NA; anti–Mac-1, n = 30; *P < 0.05; ***P = 0.0002) and (H) meandering indices (WT, n = 10; ICAM-1–mutant, n = 23; anti–LFA-1, n = NA, anti–Mac-1, n = 22; **P < 0.01) of extravasated neutrophils in experimental groups. Symbols represent individual cells, and horizontal bars depict means. Virtually no neutrophils extravasated after blockade of LFA-1. Relative times are displayed in h:min:s for all images.
Figure 6
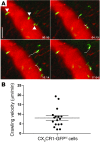
Figure 6. Intravital 2P imaging of CX3CR1-GFPhi cells in heterotopic heart transplants.
(A) Time-lapse images of WT heart grafts showing individual CX3CR1-GFPhi cells crawling, extravasating, and migrating through myocardial tissue (marked with white arrowheads and white tracks). n = 3 mice. Relative times are displayed in min:s for all images. Scale bar: 60 μm. (B) Intraluminal crawling velocity of CX3CR1-GFPhi cells. n = 17 cells. Symbols represent individual cells, horizontal bars depict means, and error bars represent SEM.
Figure 7
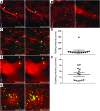
Figure 7. Intravital 2P imaging of the native murine heart.
B6 LysM-GFP hearts were imaged in their natural intrathoracic position. All mice tolerated imaging for at least 1 hour, with the majority of imaging periods lasting more than 3 hours. (A, Supplemental Video 9) Sequential video-rate frames of 2 neutrophils (yellow arrowhead with yellow track and white arrowhead with white track) moving through a coronary artery. The measured speed of the neutrophil marked in yellow is 1875.2 μm/s. (B) Representative images of native hearts in the steady state depicting capillaries (red, left panel) and a vein (red, right panel). Only few neutrophils (green) are visible. (C, E, G) 2P microscopy of beating native hearts after ischemia/reperfusion induced through transient ligation of the left coronary artery. (C) Intravascular rolling behavior of neutrophils (white arrowheads) was observed in coronary veins (white track). (D) Analysis of rolling velocities in native hearts subjected to ischemia/reperfusion injury. (E) Crawling behavior (yellow arrowhead) was associated with cell flattening along the endothelium. A second crawling neutrophil is indicated by a white arrowhead and white track. (F) Analysis of crawling velocities in native hearts subjected to ischemia/reperfusion injury. Symbols represent individual cells, horizontal bars depict mean, and error bars represent SEM. (G, Supplemental Video 10) Dynamic neutrophil clusters (yellow arrowheads) in myocardial tissue of native hearts that have been subjected to ischemia/reperfusion injury. Blood vessels (red) were labeled by intravenous injection of nontargeted 655-nm Q-dots. Relative time is displayed in h:min:s. Scale bars: 60 μm. Data are representative of 4 independent experiments.

Similar articles

Cited by

References

    1. McDonald B, et al. Intravascular danger signals guide neutrophils to sites of sterile inflammation. Science. 2010;330(6002):362–366. doi: 10.1126/science.1195491. - DOI - PubMed
    1. Yang L, Froio RM, Sciuto TE, Dvorak AM, Alon R, Luscinskas FW. ICAM-1 regulates neutrophil adhesion and transcellular migration of TNF-alpha-activated vascular endothelium under flow. Blood. 2005;106(2):584–592. doi: 10.1182/blood-2004-12-4942. - DOI - PMC - PubMed
    1. Cinamon G, Shinder V, Alon R. Shear forces promote lymphocyte migration across vascular endothelium bearing apical chemokines. Nat Immunol. 2001;2(6):515–522. doi: 10.1038/88710. - DOI - PubMed
    1. Shulman Z, et al. Lymphocyte crawling and transendothelial migration require chemokine triggering of high-affinity LFA-1 integrin. Immunity. 2009;30(3):384–396. doi: 10.1016/j.immuni.2008.12.020. - DOI - PMC - PubMed
    1. Petri B, Phillipson M, Kubes P. The physiology of leukocyte recruitment: an in vivo perspective. J Immunol. 2008;180(10):6439–6446. - PubMed

Publication types

Substances