

The Lgr5 intestinal stem cell signature: robust expression of proposed quiescent '+4' cell markers
- PMID: 22692129
- PMCID: PMC3400017
- DOI: 10.1038/emboj.2012.166
The Lgr5 intestinal stem cell signature: robust expression of proposed quiescent '+4' cell markers
Abstract
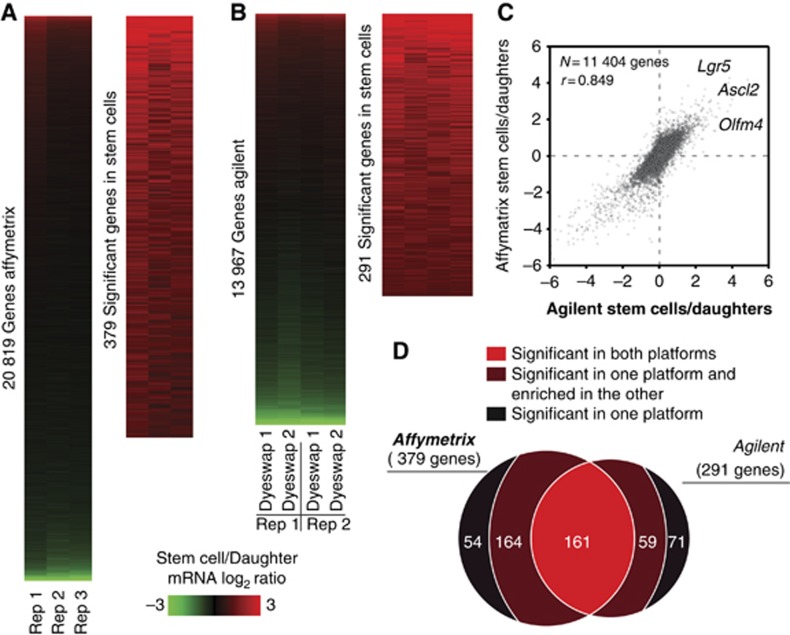
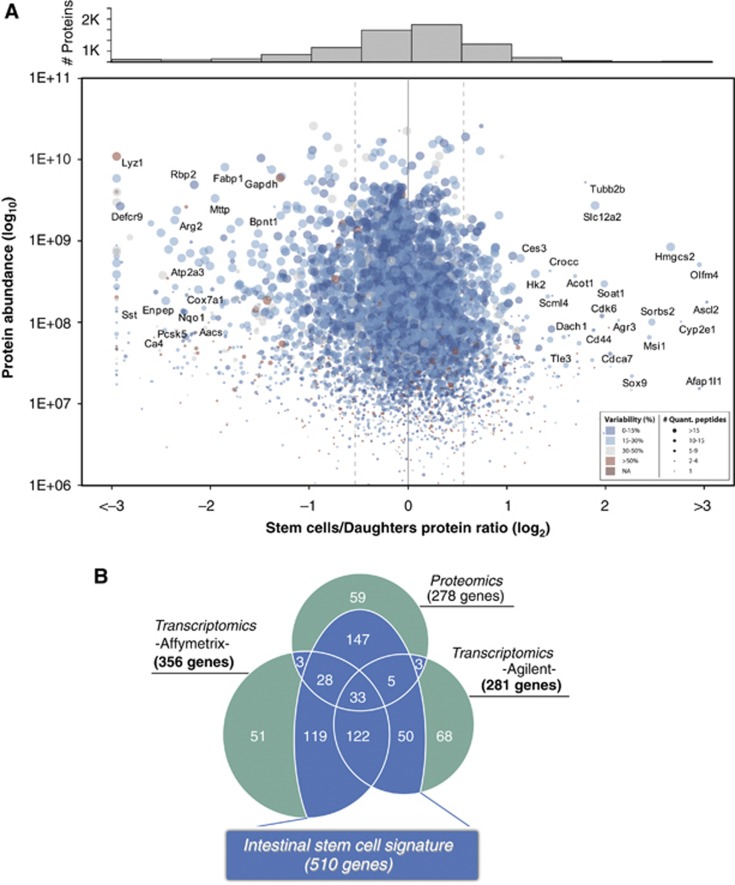
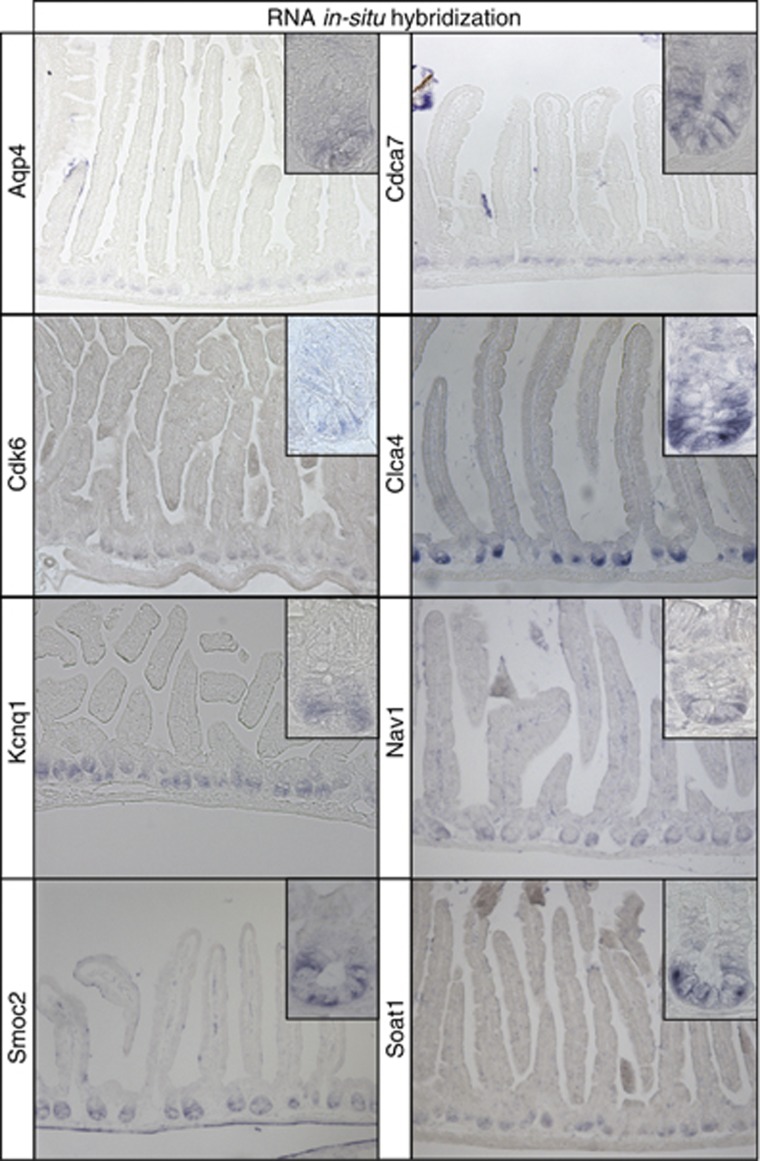
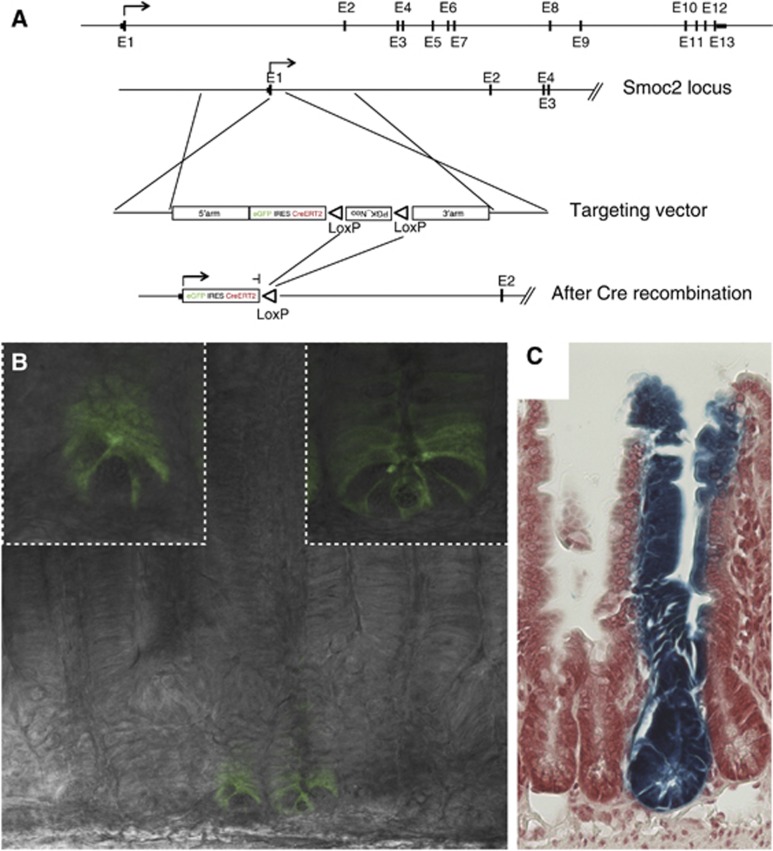
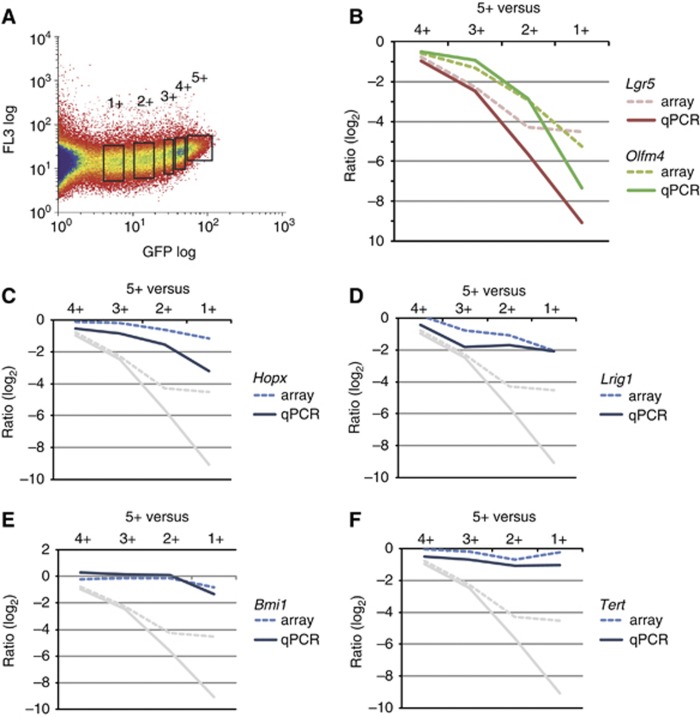
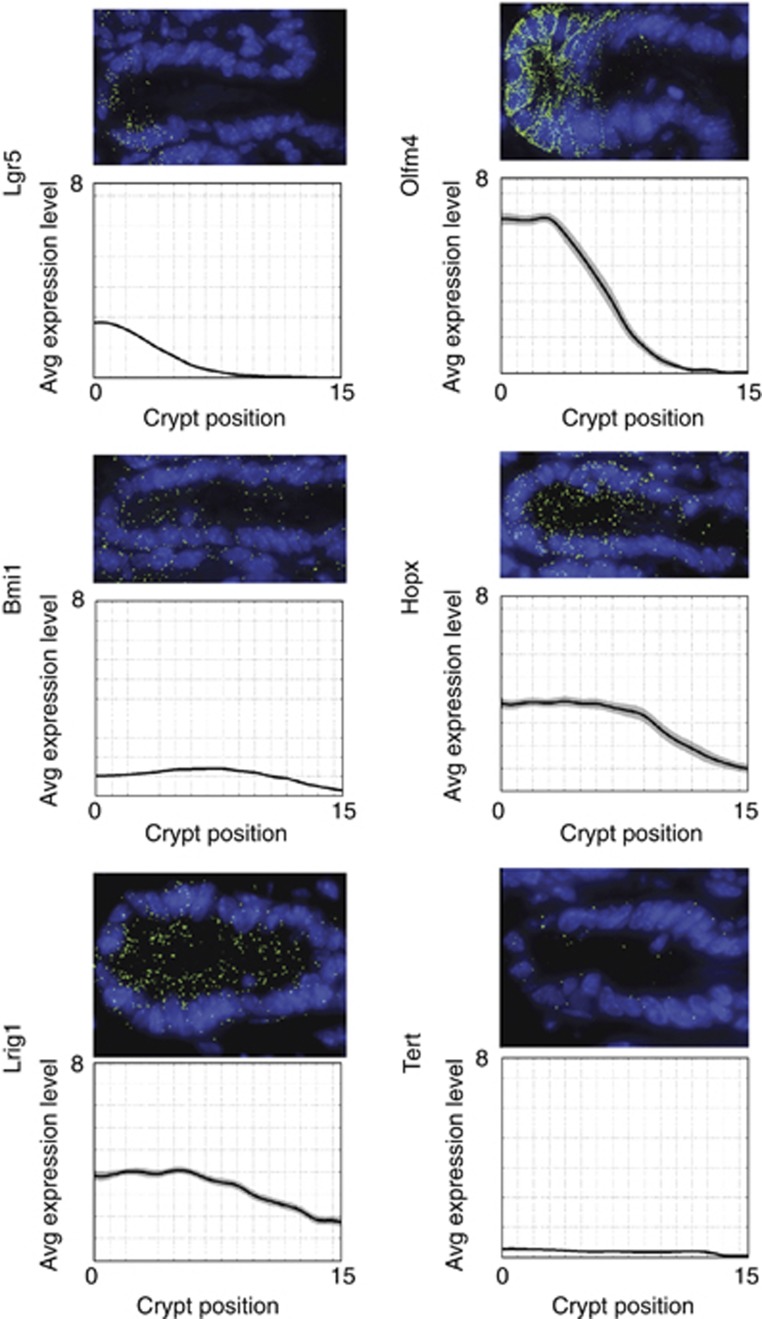
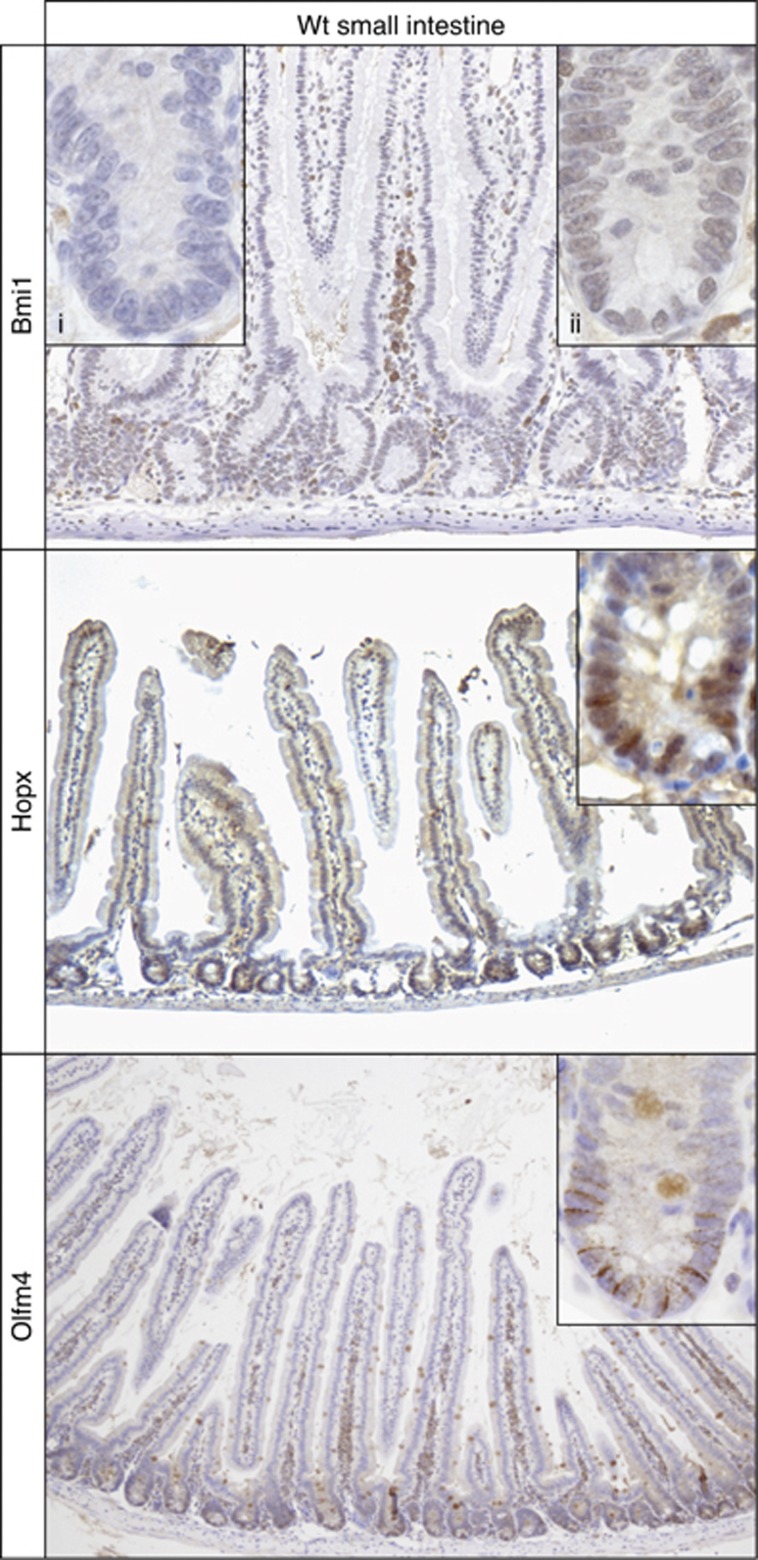
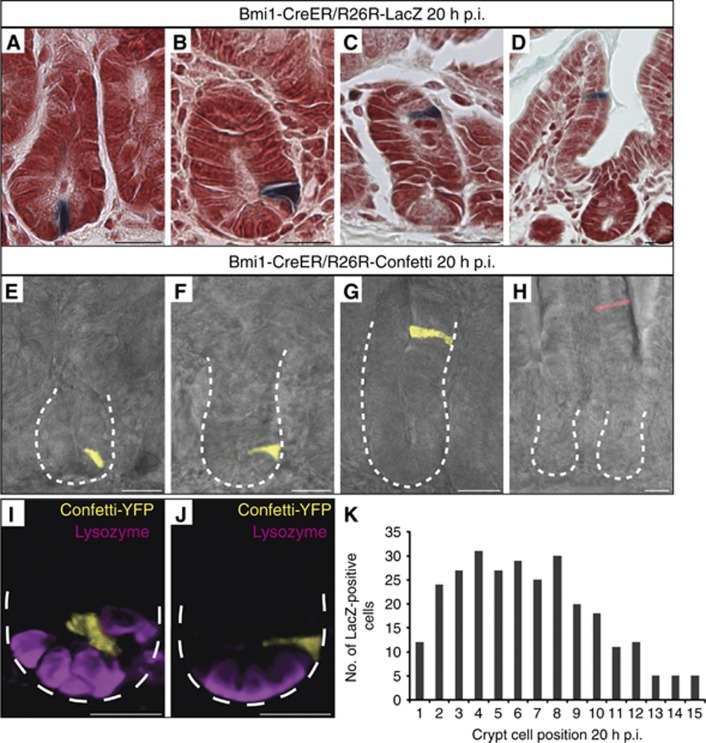
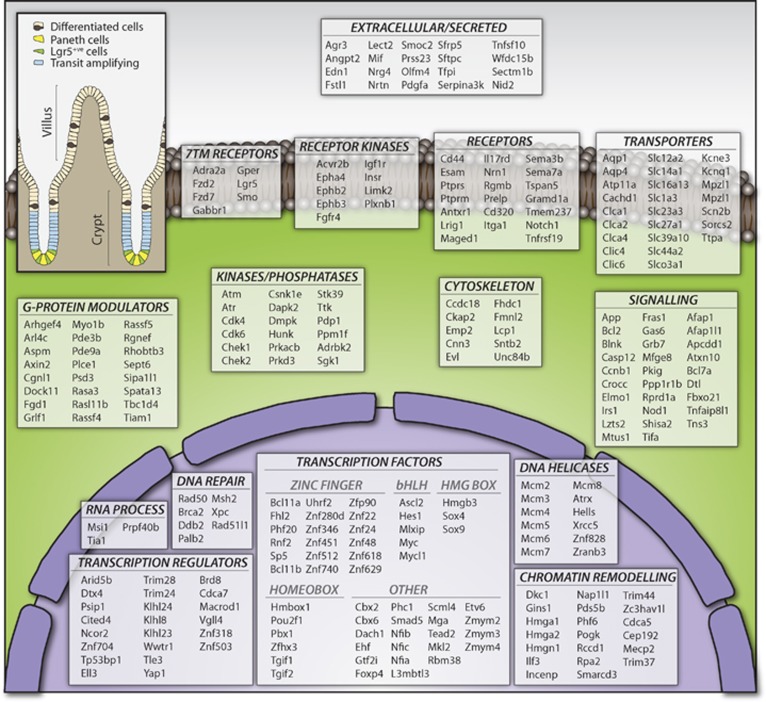
Two types of stem cells are currently defined in small intestinal crypts: cycling crypt base columnar (CBC) cells and quiescent '+4' cells. Here, we combine transcriptomics with proteomics to define a definitive molecular signature for Lgr5(+) CBC cells. Transcriptional profiling of FACS-sorted Lgr5(+) stem cells and their daughters using two microarray platforms revealed an mRNA stem cell signature of 384 unique genes. Quantitative mass spectrometry on the same cell populations identified 278 proteins enriched in intestinal stem cells. The mRNA and protein data sets showed a high level of correlation and a combined signature of 510 stem cell-enriched genes was defined. Spatial expression patterns were further characterized by mRNA in-situ hybridization, revealing that approximately half of the genes were expressed in a gradient with highest levels at the crypt bottom, while the other half was expressed uniquely in Lgr5(+)stem cells. Lineage tracing using a newly established knock-in mouse for one of the signature genes, Smoc2, confirmed its stem cell specificity. Using this resource, we find-and confirm by independent approaches-that the proposed quiescent/'+4' stem cell markers Bmi1, Tert, Hopx and Lrig1 are robustly expressed in CBC cells.
Conflict of interest statement
The authors declare that they have no conflict of interest.
Figures
Similar articles
-
Expansion of intestinal epithelial stem cells during murine development.PLoS One. 2011;6(11):e27070. doi: 10.1371/journal.pone.0027070. Epub 2011 Nov 10. PLoS One. 2011. PMID: 22102874 Free PMC article.
-
Intact function of Lgr5 receptor-expressing intestinal stem cells in the absence of Paneth cells.Proc Natl Acad Sci U S A. 2012 Mar 6;109(10):3932-7. doi: 10.1073/pnas.1113890109. Epub 2012 Feb 21. Proc Natl Acad Sci U S A. 2012. PMID: 22355124 Free PMC article.
-
Paneth cells in intestinal homeostasis and tissue injury.PLoS One. 2012;7(6):e38965. doi: 10.1371/journal.pone.0038965. Epub 2012 Jun 20. PLoS One. 2012. PMID: 22745693 Free PMC article.
-
Wnt signaling, lgr5, and stem cells in the intestine and skin.Am J Pathol. 2009 Mar;174(3):715-21. doi: 10.2353/ajpath.2009.080758. Epub 2009 Feb 5. Am J Pathol. 2009. PMID: 19197002 Free PMC article. Review.
-
Environmental Impact on Intestinal Stem Cell Functions in Mucosal Homeostasis and Tumorigenesis.J Cell Biochem. 2017 May;118(5):943-952. doi: 10.1002/jcb.25719. Epub 2017 Jan 11. J Cell Biochem. 2017. PMID: 27584938 Free PMC article. Review.
Cited by
-
Cell lineage identification and stem cell culture in a porcine model for the study of intestinal epithelial regeneration.PLoS One. 2013 Jun 28;8(6):e66465. doi: 10.1371/journal.pone.0066465. Print 2013. PLoS One. 2013. PMID: 23840480 Free PMC article.
-
KIT Signaling Promotes Growth of Colon Xenograft Tumors in Mice and Is Up-Regulated in a Subset of Human Colon Cancers.Gastroenterology. 2015 Sep;149(3):705-17.e2. doi: 10.1053/j.gastro.2015.05.042. Epub 2015 May 28. Gastroenterology. 2015. PMID: 26026391 Free PMC article.
-
Nutrient metabolism in regulating intestinal stem cell homeostasis.Cell Prolif. 2024 Jun;57(6):e13602. doi: 10.1111/cpr.13602. Epub 2024 Feb 22. Cell Prolif. 2024. PMID: 38386338 Free PMC article. Review.
-
Heterogeneity in readouts of canonical wnt pathway activity within intestinal crypts.Dev Dyn. 2016 Aug;245(8):822-33. doi: 10.1002/dvdy.24423. Epub 2016 Jul 5. Dev Dyn. 2016. PMID: 27264700 Free PMC article.
-
The Heterochromatin protein 1 is a regulator in RNA splicing precision deficient in ulcerative colitis.Nat Commun. 2022 Nov 18;13(1):6834. doi: 10.1038/s41467-022-34556-3. Nat Commun. 2022. PMID: 36400769 Free PMC article.
References
-
- Barker N, Huch M, Kujala P, van de Wetering M, Snippert HJ, van Es JH, Sato T, Stange DE, Begthel H, van den Born M, Danenberg E, van den Brink S, Korving J, Abo A, Peters PJ, Wright N, Poulsom R, Clevers H (2010) Lgr5(+ve) stem cells drive self-renewal in the stomach and build long-lived gastric units in vitro. Cell Stem Cell 6: 25–36 - PubMed
-
- Barker N, Ridgway RA, van Es JH, van de Wetering M, Begthel H, van den Born M, Danenberg E, Clarke AR, Sansom OJ, Clevers H (2009) Crypt stem cells as the cells-of-origin of intestinal cancer. Nature 457: 608–611 - PubMed
-
- Barker N, van Es JH, Kuipers J, Kujala P, van den Born M, Cozijnsen M, Haegebarth A, Korving J, Begthel H, Peters PJ, Clevers H (2007) Identification of stem cells in small intestine and colon by marker gene Lgr5. Nature 449: 1003–1007 - PubMed
-
- Bjerknes M, Cheng H (2006) Intestinal epithelial stem cells and progenitors. Meth Enzymol 419: 337–383 - PubMed
Publication types
MeSH terms
Substances
Grants and funding
LinkOut - more resources
Full Text Sources
Other Literature Sources
Medical
Molecular Biology Databases
Miscellaneous
