. 2012 Jul;122(7):2369-83.
doi: 10.1172/JCI58457. Epub 2012 Jun 11.

Tyrosine kinase pathways modulate tumor susceptibility to natural killer cells

Affiliations

Tyrosine kinase pathways modulate tumor susceptibility to natural killer cells

Roberto Bellucci et al. J Clin Invest. 2012 Jul.

Abstract

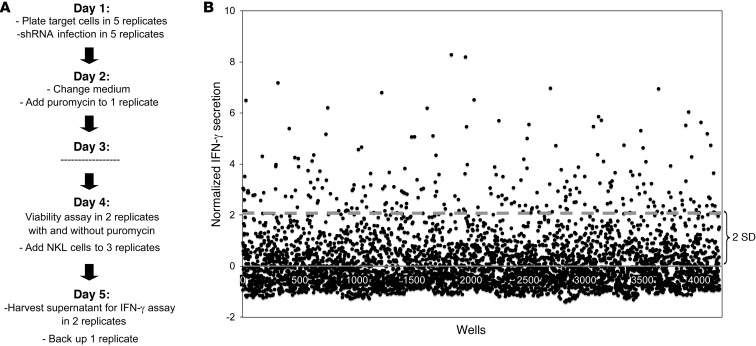
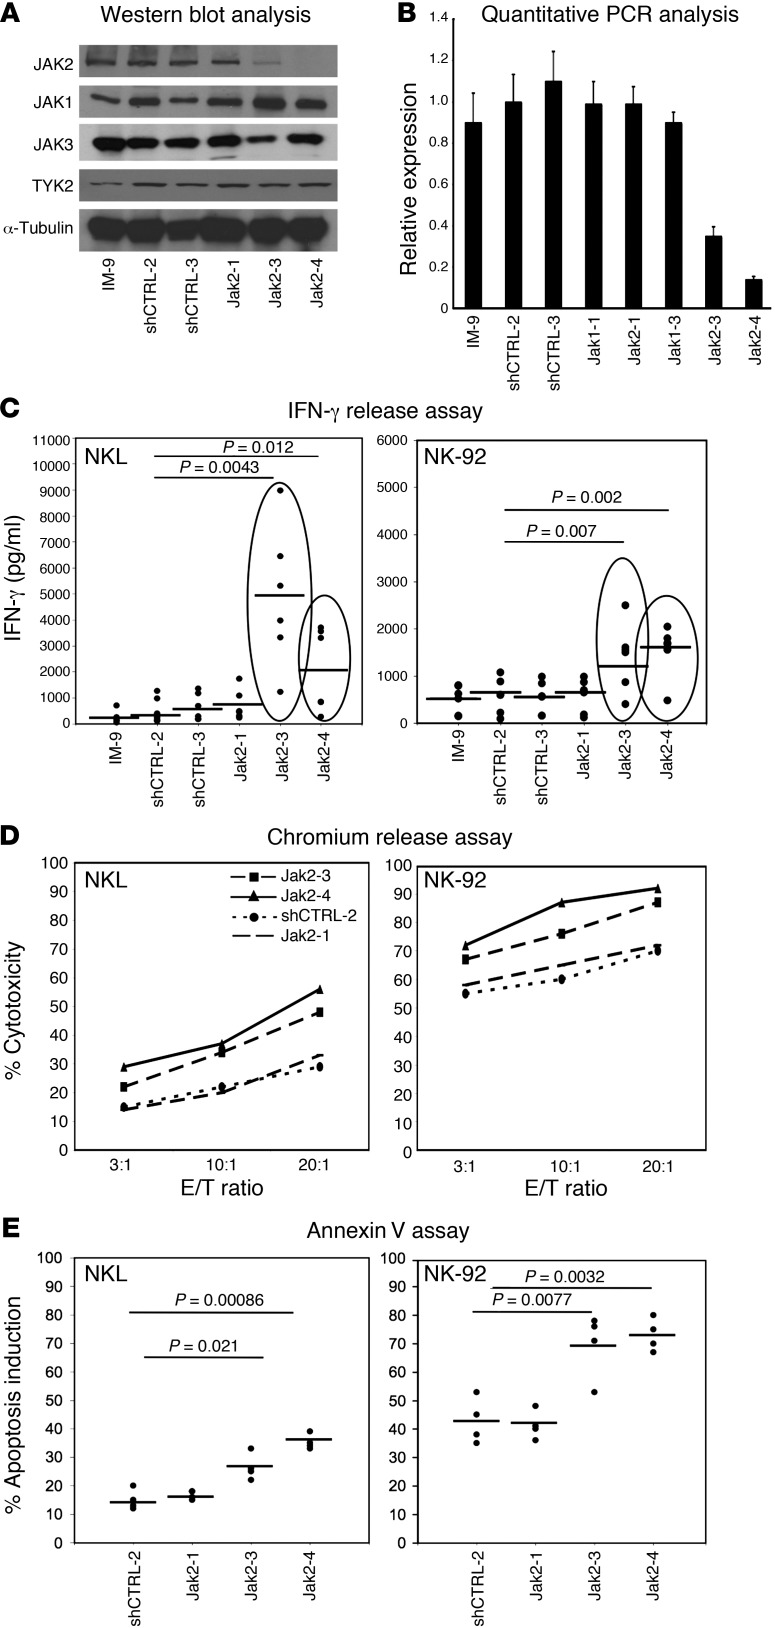
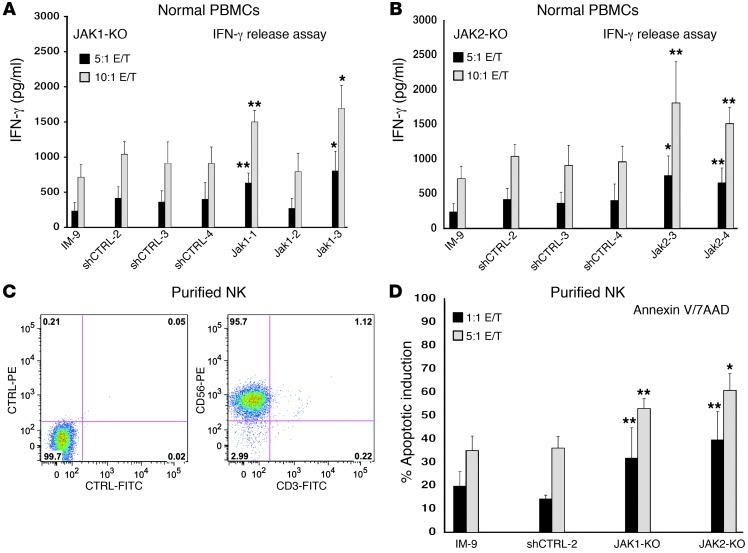
Natural killer (NK) cells are primary effectors of innate immunity directed against transformed tumor cells. In response, tumor cells have developed mechanisms to evade NK cell-mediated lysis through molecular mechanisms that are not well understood. In the present study, we used a lentiviral shRNA library targeting more than 1,000 human genes to identify 83 genes that promote target cell resistance to human NK cell-mediated killing. Many of the genes identified in this genetic screen belong to common signaling pathways; however, none of them have previously been known to modulate susceptibility of human tumor cells to immunologic destruction. Gene silencing of two members of the JAK family (JAK1 and JAK2) increased the susceptibility of a variety of tumor cell types to NK-mediated lysis and induced increased secretion of IFN-γ by NK cells. Treatment of tumor cells with JAK inhibitors also increased susceptibility to NK cell activity. These findings may have important clinical implications and suggest that small molecule inhibitors of tyrosine kinases being developed as therapeutic antitumor agents may also have significant immunologic effects in vivo.


Figures

Figure 1
Figure 1. Genetic screen to identify modulators of susceptibility to human NK cells.
(A) Schematic representation of the 5-day workflow. (B) Normalized distribution of the levels of IFN-γ secretion by NKL cells for 4,177 selected shRNAs.
Figure 2
Figure 2. Validation of selected genes in IM-9 target cells with stable expression of individual shRNAs.
IM-9 cells expressing 3 different shRNAs targeting MAPK1, JAK1, JAK2, IGF1R, and INSR were incubated overnight with NKL and NK-92 effector cells at a 1:1 E/T ratio. (A) Increased IFN-γ secretion induced in NKL or NK-92 compared with IM-9 target cells incorporating an irrelevant shRNA control. (B) Specific downregulation of MAPK1, JAK1, and JAK2 proteins by individual shRNAs was analyzed by Western blotting. (C) Specific downregulation of IGF1R and INSR by individual shRNAs was analyzed by flow cytometry. PE-CTRL, PE-conjugated secondary antibody alone.
Figure 3
Figure 3. Analysis of IM-9 cells expressing shRNAs targeting TYK2 and JAK3.
(A) Effects of 4 shRNAs targeting TYK2 on levels of IFN-γ secretion by NKL or NK-92 effector cells incubated with IM-9-TYK2 at a 1:1 E/T ratio. (B) Effects of 4 shRNAs targeting JAK3 on levels of IFN-γ secretion by NKL or NK-92 effector cells incubated with IM-9-JAK3 at a 1:1 E/T ratio. Data represent the mean of 4 independent experiments with each target tested in duplicate. (C) Protein levels in each target cell line were evaluated by Western blotting using anti-TYK2 and anti-JAK3 specific antibodies.
Figure 4
Figure 4. Analysis of IM-9 cells expressing shRNAs targeting JAK1.
(A) Western blot analysis of IM-9 target cells with stable incorporation of different sh­RNAs targeting JAK1 (Jak1-1, Jak1-2, and Jak1-3), irrelevant shRNAs (shCTRL-2 and shCTRL-3), and parental IM-9. (B) RNAs from parental IM-9 and each IM-9 with stable expression of JAK1, JAK2, and control shRNAs were also evaluated for JAK1 gene expression. Data represent the relative expression of JAK1 in parental IM-9 cells, 2 controls (shCTRL-2 and shCTRL-3), IM-9 cells expressing 3 shRNAs targeting JAK1 (Jak1-1, Jak1-2, and Jak1-3), and IM-9 cells expressing 2 shRNAs targeting JAK2 (Jak2-3 and Jak2-4). (C) IFN-γ secretion by NKL or NK-92 effector cells incubated with stable IM-9-JAK1-kockdown cells at a 1:1 E/T ratio for 12 hours. Data represent the median of 6 independent experiments with each target cell tested in duplicate. (D) Specific lysis of stable IM-9-JAK1-knockdown target cells incubated with NKL or NK-92 effector cells. Percent lysis was determined in a 4-hour chromium release assay for samples incubated at different E/T ratios. Data represent percent killing in 3 different experiments tested in triplicate. (E) Percent apoptosis induced by NKL or NK-92 effector cells incubated at a 1:1 E/T ratio for 12 hours with stable IM-9-JAK1-knockdown cells. Cells were stained with a PE-conjugated NKG2A antibody, and the analysis of apoptotic cells was performed on the gated target cells (NKG2A negative). Data represent the mean percent apoptosis induction in 4 independent experiments tested in duplicate. The level of spontaneous apoptosis in IM-9-JAK1-knockdown was subtracted in every experiment.
Figure 5
Figure 5. Analysis of IM-9 cells expressing shRNAs targeting JAK2.
(A) Western blot analysis of parental IM-9 cells and of IM-9 target cells with stable incorporation of 3 different shRNAs targeting the JAK2 gene (Jak2-1, Jak2-3, and Jak2-4) and control shRNAs (shCTRL-2 and shCTRL-3). (B) RNA from parental IM-9 cells and each IM-9 with stable expression of JAK2, JAK1, and control shRNAs were also evaluated for JAK2 gene expression. Data represent the relative expression of JAK2 in IM-9-Jak2-3 and IM-9-Jak2-4 cells compared with JAK2 expression in IM-9 parental cells, 2 irrelevant controls (shCTRL-2 and shCTRL-3), and IM-9 cells in which JAK1 was silenced with Jak1-1, Jak1-2, and Jak1-3. (C) Level of IFN-γ secretion by NKL or NK-92 effector cells incubated with stable IM-9-JAK2-knockdown cells at a 1:1 E/T ratio for 12 hours. Data represent the median of 6 independent experiments, with each target cell tested in duplicate. (D) Four-hour chromium release assay measuring specific lysis of IM-9-JAK2-knockdown target cells incubated with NKL or NK-92 cells at different E/T ratios. Data represent the mean percentage of killing in 3 different experiments tested in triplicate. (E) Percent apoptosis induced by NKL or NK-92 effector cells incubated with stable IM-9-JAK2-knockdown cells at a 1:1 E/T ratio for 12 hours. Cells were stained with a PE-conjugated NKG2A antibody, and the analysis of apoptotic cells was performed on the gated target cells (NKG2A negative). Data represent the mean percent apoptosis induction in 4 independent experiments tested in duplicate. The level of spontaneous apoptosis in IM-9-JAK2-knockdown cells was subtracted in every experiment.
Figure 6
Figure 6. Interaction of IM-9 target cells with primary human NK cells.
(A) IM-9 cells transfected with Jak1-1, Jak1-2, and Jak1-3 shRNAs or (B) Jak2-3 and Jak2-4 shRNAs were incubated with PBMCs from 4 different healthy donors at 5:1 and 10:1 E/T ratios in an IFN-γ release assay. Parental cells and IM-9 cells expressing 3 different shRNAs (shCTRL-2, shCTRL-3, and shCTRL-4) were used as controls in all experiments. In 4 additional experiments, NK cells were purified from PBMCs before incubation with IM-9-JAK1-KO or IM-9-JAK2-KO target cells. (C) NK purity (% CD56+CD3) was at least 90%. (D) Apoptosis of target cells was measured by staining for Annexin V/7AAD using flow cytometry. NK cells were tested at 1:1 and 5:1 E/T ratios. *P < 0.01, **P < 0.05 compared with shCTRL-2.
Figure 7
Figure 7. Effects of JAK1 and JAK2 silencing in different leukemia/lymphoma cell lines.
Seven tumor cell lines incorporating 3 different shRNAs targeting JAK1 (A) and JAK2 (B) were tested at a 1:1 E/T ratio with NKL or NK-92 effector cells. Values represent the percent increase in IFN-γ secretion by NK effector cells after incubation with target cells expressing specific shRNAs compared with cells expressing a control shRNA.
Figure 8
Figure 8. Induction of target cell apoptosis by NK cells after treatment of target cells with JAK inhibitors.
(A) IM-9 target cells treated with JAK inhibitors (JAK inhib.) for 12 hours and subsequently incubated with NK-92 at a 1:1 E/T ratio. NK-92 cells are nearly 100% NKG2A+, and the analysis of apoptotic cells was performed on gated target cells (NKG2A negative). Target cells alone incubated with inhibitors (left scatter plots) were analyzed for the level of apoptosis induced by the JAK inhibitors, and these values were subtracted from the level of apoptosis induced by addition of NK-92 cells (right scatter plots). (B) Increased apoptosis induced by NK-92 cells after treatment of target cells with 2 JAK inhibitors. Results are compared with untreated targets incubated with NK-92 cells. Data represent the mean percentages ± SEM obtained in 3 separate experiments. (C) IM-9-JAK1-KO and IM-9-JAK2-KO cells were treated with medium alone or 40 nM JAK inhibitor 1 or 1 μM AG-490 for 12 hours and subsequently incubated with NK-92 effector cells. Induced apoptosis was compared with IM-9 cells expressing a control shRNA (shCTRL-2). Data represent the mean ± SEM of 2 separate experiments. (D) NKL and NK-92 cells were pretreated with different concentrations of JAK inhibitors and tested for their reactivity against IM-9 using Annexin V/7AAD. Data represent the mean percentages of 3 separate experiments ± SEM tested in duplicate. (E) Percent apoptosis induction by purified primary NK cells after IM-9 treatment with different concentrations of 2 JAK inhibitors. *P < 0.01, **P < 0.05 compared with target cells without inhibitor.
Figure 9
Figure 9. Induction of apoptosis in primary tumor cells by NK cells after treatment with JAK inhibitor.
Percent apoptosis induction by NK-92 effector cells after treatment of primary MM (n = 4), AML (n = 5), and ALL (n = 5) tumor cells with different concentration of JAK inhibitor 1. Treated tumor cells were incubated at 1:1 E/T ratio, and the analysis of apoptotic cells was performed on gated target cells (NKG2A negative) using Annexin V/7AAD. *P < 0.01, **P < 0.02 compared with target cells treated without inhibitor.
Figure 10
Figure 10. Top 34 differentially expressed genes in IM-9-JAK1-KO compared with control IM-9 cells.
(A) Gene expression of 2 independent experiments (#1 and #2) using the Gene 1.0 ST Array. Samples from IM-9 cell lines expressing 2 JAK1 shRNAs (Jak1-1 and Jak1-3) were compared with IM-9 cells expressing an irrelevant shRNA (shCTRL-2) and with IM-9 parental cells. Top-scoring genes were defined by a minimal fold-change of 1.5 and maximal q value of 0.4. (B) IM-9-JAK1, JAK2-KO, and control cells were cultured for 12 hours and CXCL10 in culture supernatant was measured using an ELISA assay. Data represent the mean values ± SEM of 3 independent experiments run in triplicate. *P < 0.05 compared with IM-9 cells transduced with an irrelevant shRNA. (C) IM-9-JAK1-KO, IM-9-JAK2-KO, IM-9, and IM-9 cells transduced with an irrelevant shRNA (shCTRL-2) were stained with an anti–TRAIL-R1–PE antibody and analyzed by flow cytometry. (D) IM-9-JAK1-KO, IM-9-JAK2-KO, and IM-9-shCTRL-2 cells were co-incubated with NKL at a 1:1 E/T ratio with or without CXCL10 blocking antibody for 12 hours. Data represent the mean values + SEM of IFN-γ secreted by NKL cells in 4 independent experiments. (E) IM-9-JAK1-KO, IM-9-JAK2-KO, and IM-9-shCTRL-2 cells were co-incubated with NKL at a 1:1 E/T ratio with or without TRAIL-R1–Fc chimera for 12 hours. Data represent the mean values + SEM of IFN-γ secreted by NKL cells in 3 independent experiments. *P < 0.05, **P < 0.01.

Similar articles

Cited by

References

    1. Caligiuri MA. Human natural killer cells. Blood. 2008;112(3):461–469. doi: 10.1182/blood-2007-09-077438. - DOI - PMC - PubMed
    1. Vivier E, et al. Innate or adaptive immunity? The example of natural killer cells. Science. 2011;331(6013):44–49. doi: 10.1126/science.1198687. - DOI - PMC - PubMed
    1. Lanier LL. Up on the tightrope: natural killer cell activation and inhibition. Nat Immunol. 2008;9(5):495–502. doi: 10.1038/ni1581. - DOI - PMC - PubMed
    1. Moretta L, Biassoni R, Bottino C, Mingari MC, Moretta A. Human NK-cell receptors. Immunol Today. 2000;21(9):420–422. doi: 10.1016/S0167-5699(00)01673-X. - DOI - PubMed
    1. Berns K, et al. A large-scale RNAi screen in human cells identifies new components of the p53 pathway. Nature. 2004;428(6981):431–437. doi: 10.1038/nature02371. - DOI - PubMed

Publication types

MeSH terms