. 2012 Jul;18(7):1087-94.
doi: 10.1038/nm.2834.

Silencing microRNA-134 produces neuroprotective and prolonged seizure-suppressive effects

Affiliations

Silencing microRNA-134 produces neuroprotective and prolonged seizure-suppressive effects

Eva M Jimenez-Mateos et al. Nat Med. 2012 Jul.

Abstract

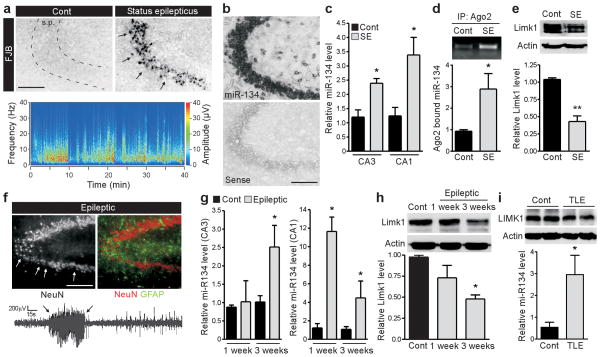
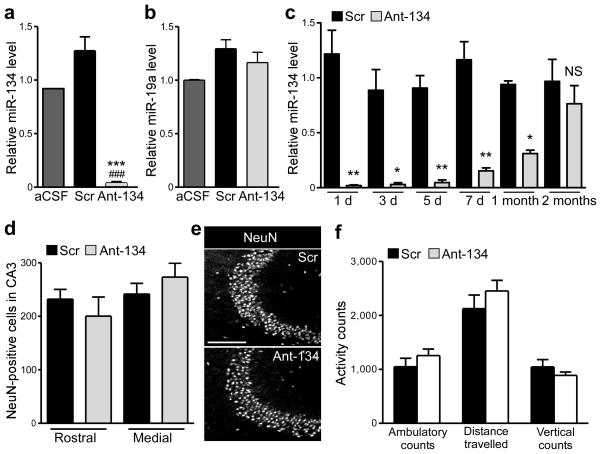
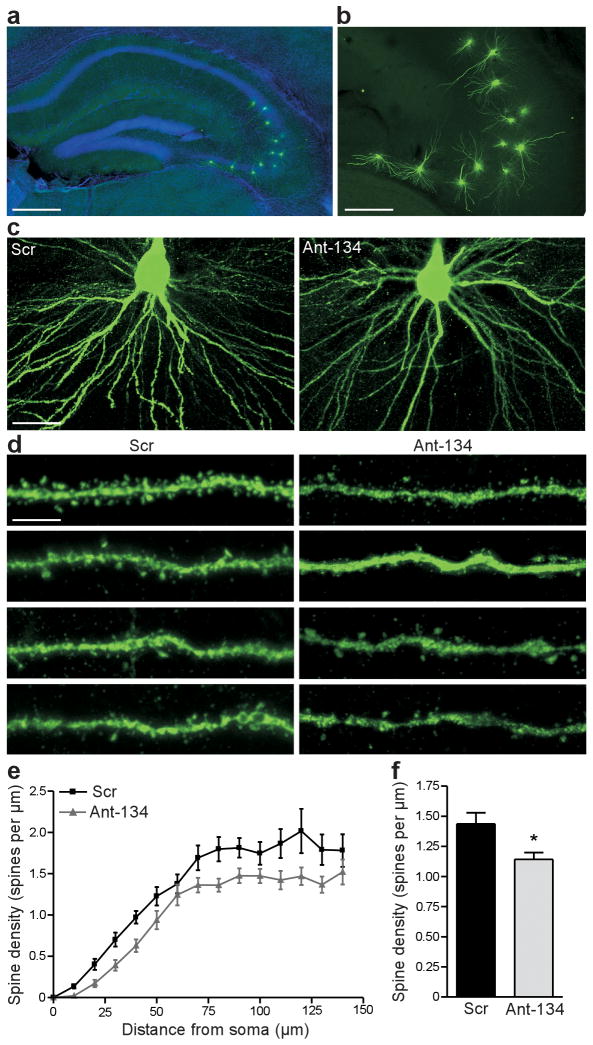
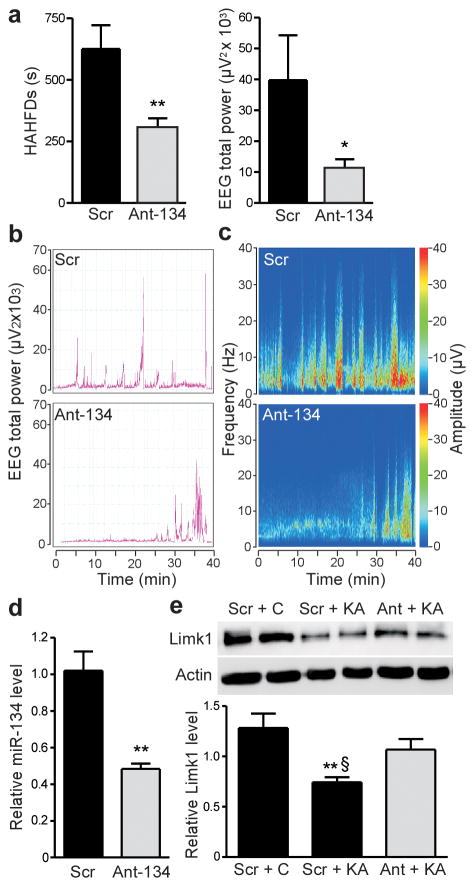
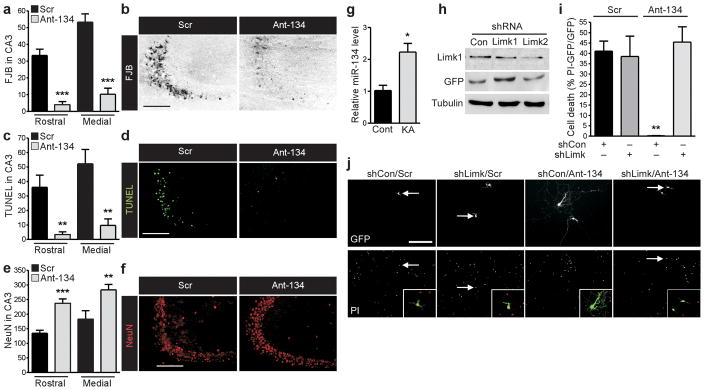
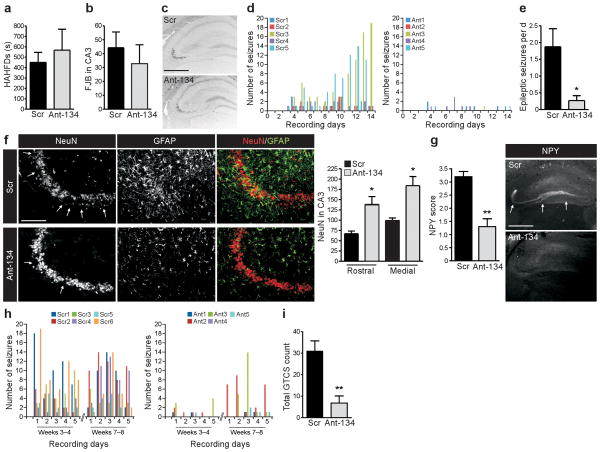
Temporal lobe epilepsy is a common, chronic neurological disorder characterized by recurrent spontaneous seizures. MicroRNAs (miRNAs) are small, noncoding RNAs that regulate post-transcriptional expression of protein-coding mRNAs, which may have key roles in the pathogenesis of neurological disorders. In experimental models of prolonged, injurious seizures (status epilepticus) and in human epilepsy, we found upregulation of miR-134, a brain-specific, activity-regulated miRNA that has been implicated in the control of dendritic spine morphology. Silencing of miR-134 expression in vivo using antagomirs reduced hippocampal CA3 pyramidal neuron dendrite spine density by 21% and rendered mice refractory to seizures and hippocampal injury caused by status epilepticus. Depletion of miR-134 after status epilepticus in mice reduced the later occurrence of spontaneous seizures by over 90% and mitigated the attendant pathological features of temporal lobe epilepsy. Thus, silencing miR-134 exerts prolonged seizure-suppressant and neuroprotective actions; determining whether these are anticonvulsant effects or are truly antiepileptogenic effects requires additional experimentation.


Conflict of interest statement

COMPETING FINANCIAL INTERESTS

The authors declare no competing financial interests.

Figures

Figure 1
Figure 1
miR-134 up-regulation following SE and in epilepsy. (a) Photomicrographs show neuronal death (Fluoro-Jade B, FJB) in CA3 stratum pyramidale (s.p.) 24 h after SE compared to control (Cont). Below, depiction of electrographic seizure frequency and amplitude during SE. (b) In situ hybridization showing miR-134 in soma of CA3 pyramidal neurons. (c) RT-qPCR measurement of miR-134 (normalized to RNU19) for CA3 (P = 0.016) and CA1 (P = 0.035) 24 h after SE (n = 5 per group). (d) Argonaute-2 (Ago2) –immunoprecipitated (IP) miR-134 from Cont and SE mice (24 h) (P = 0.035, n = 3 per group). (e) Limk1 western blot (24 h) and densitometry (P = 0.001, n = 5 per group). (f) Photomicrographs showing loss of CA3 neurons (NeuN, arrows) and astrogliosis (GFAP) in epileptic mice 14 days after SE and (below) a telemetry-recorded spontaneous seizure. (g) miR-134 levels in epileptic mice for CA3 (1 week, P = 0.806; 3 weeks, P = 0.049) and CA1 (1 week, P = 0.003; 3 weeks, P = 0.008) (n = 5 per group). (h) Western blot shows Limk1 levels 1 and 3 weeks after SE and densitometry (P = 0.028; n = 4 per group). (i) miR-134 levels in temporal lobe samples from individuals with TLE compared to autopsy controls (Cont) (P = 0.029; n = 3 per group). Western blot (above) shows LIMK1 levels (Unpaired t-test, P = 0.039, n = 3 per group, not shown). Scale bars, 200μm. *P < 0.05, **P < 0.01 compared to Cont.
Figure 2
Figure 2
Antagomir-mediated silencing of miR-134 in mouse hippocampus. (a–b) RT-qPCR measurement of a) miR-134 (P < 0.001) and b) miR-19a (P = 0.363) in hippocampus 24 h after i.c.v. injection of miR-134-targeting antagomir (Ant-134) or a non-targeting control (Scr). ***P < 0.001 compared to artificial cerebrospinal fluid (aCSF); ###P < 0.001 compared to Scr (n = 3 per group). (c) miR-134 levels in hippocampus after injection of Ant-134 or Scr at 1 d (P = 0.005), 3 d (P = 0.01), 5 d (P = 0.001), 7 d (P = 0.004), 1 month (P = 0.034) and 2 months (P = 0.469) later. *P < 0.05; **P < 0.01; NS, non-significant (n = 3–4 per group). (d) NeuN counts at two different levels of the dorsal hippocampus in animals injected 24 h earlier with either Scr or Ant-134 (rostral, P = 0.585; medial, P = 0.387) (n = 4 per group). (e) NeuN staining of the CA3 subfield 24 h after injection of Scr or Ant-134. Scale bar: e, 200 μm. (f) Behavioral analysis of mice injected 24 h earlier either with Scr or Ant-134. Graph shows indices of exploratory activity: total ambulatory counts (P = 0.310); distance travelled (cm) (P = 0.320); vertical counts (P = 0.300).
Figure 3
Figure 3
Antagomir silencing of miR-134 reduces hippocampal CA3 spine density in vivo. (a) Field view of hippocampus showing Lucifer yellow-injected CA3 neurons (green) and nuclei (DAPI, blue). (b) Higher magnification of (a) showing injected CA3 neurons. (c) Photomicrographs of the basal tree from Lucifer yellow-injected animals treated with either Scr or Ant-134 24 h earlier. (d) Representative images of individual dendrites from four individual animals injected with Scr (left panels) or Ant-134 (right panels). (e) Spine density as a function of the distance from the soma (Sholl Analysis) for Scr and Ant-134 animals. (f) Spine density in Scr and Ant-134 mice (P = 0.037; *P < 0.05 compared to Scr, n = 7 per group). Scale bars: a, 500 μm; b, 100 μm; c, 20 μm. d, 12 μm.
Figure 4
Figure 4
Antagomir silencing of miR-134 reduces seizure severity during SE. (a) Graphs show HAHFDs (P = 0.0051) and total EEG power (P = 0.033) during SE in animals injected 24 h earlier with Scr or Ant-134. *P < 0.05, **P < 0.01 compared to Scr (n = 4–8 per group). (b) Total EEG power and (c) frequency and amplitude parameters during SE from representative Scr- and Ant-134 injected animals covering the period between KA injection and anticonvulsant administration. (d) miR-134 levels in Scr and Ant-134 animals 24 h after SE (P = 0.0078, n = 4). **P < 0.01 compared to Scr. (e) Limk1 protein levels in non-seizure, Scr-injected (Scr + C) and after SE in mice given Scr (Scr + SE) or Ant-134 (Ant + SE) (n = 1 per lane). Graph shows Limk1 levels normalized to actin (Scr + C compared to Scr + SE, P = 0.007; Scr vs Ant-134 after SE (P = 0.018; Scr + C compared to Ant-134 + SE, P = 0.270). **P < 0.01 compared to Scr + C; §P < 0.05 compared to Ant-134 + SE) (n = 4 per group).
Figure 5
Figure 5
Antagomir silencing of miR-134 protects against SE in vivo and KA toxicity in vitro. (a–f) Graphs and photomicrographs (dorsal hippocampus) 24 h after SE in mice given Scr or Ant-134 showing (a, b) FJB counts (rostral, P < 0.001; medial, P < 0.001), (c, d) TUNEL counts (rostral, P = 0.001; medial, P = 0.001), (e, f) NeuN counts (rostral, P < 0.001, medial, P = 0.009).**P < 0.01, ***P < 0.001 compared to Scr (n = 4–8 per group). Scale bars, 200 μm. (g) miR-134 levels in primary hippocampal neurons 24 h after KA (0.3 μM) (P = 0.019). *P < 0.05, n = 3 per group. (h) Western blots show Limk1 and GFP in SH-SY5Y cells transfected with shControl (Con) or different short interfering RNAs targeting Limk1 (shLimk1/2). shLimk2 reduced Limk1 by ~48% (average of two experiments). (i) Percentage cell death induced by KA in hippocampal neurons (ratio of propidium iodide (PI) positive-GFP positive neurons over GFP-positive), and effect of Scr or Ant-134 in cells co-transfected with either Con or Limk shRNA. Cell death in non-transfected neurons in either group averaged 30 ± 12% (data not shown). shCon/Scr compared to shCon/Ant-134, P = 0.005; shLimk/Scr compared to shCon/Ant-134, P = 0.004; shCon/Ant-134 compared to shLimk/Ant-134, P = 0.001). **P < 0.01, n = 4 per group. (j) Photomicrographs of hippocampal neurons in each condition. Arrows (and see inset) indicate dead cells positive for both GFP (green) and PI (red). Scale bar, 50 μm.
Figure 6
Figure 6
Antagomir silencing of miR-134 reduces post-SE epileptic seizures and protects against progressive TLE pathology. (a,b) Graphs show a) KA-triggered seizures (P = 0.589) and b) CA3 damage at 24 h (P = 0.541) between Ant-134 and Scr groups when the antagomirs were injected 1 h after inducing SE (n = 4–5 per group). (c) FJB staining 24 h after SE in mice injected 1 h after KA with Scr or Ant-134. (d) Graphs show telemetry-detected spontaneous seizures for individual animals during the two weeks following SE for (left) Scr and (right) Ant-134 mice. (e) Daily epileptic seizures in Scr and Ant-134 animals (P = 0.036; n = 5 per group). (f) Hippocampal NeuN (arrows indicate neuron loss) and GFAP (astrogliosis) staining in Scr and Ant-134 mice after two weeks epilepsy monitoring. Graph to the right shows NeuN counts in dorsal hippocampus (rostral, P = 0.024, medial, P = 0.02) (*P < 0.05, n = 5 per group). (g) Neuropeptide Y (NPY) score in epileptic animals (P = 0.008, n = 5 per group) and (right) representative NPY-stained sections from Scr and Ant-134 mice after two weeks epilepsy monitoring. Scale bars: f, 200μm; c, g, 1 mm. (h) Graphs show the number of generalized tonic-clonic seizures (GTCS) each day for individual animals during two periods of five days continuous video monitoring following SE for (left) Scr and (right) Ant-134 mice. (i) Total GTCS counts averaged from the two monitoring periods (**P = 0.003, n = 5–6 per group).

Similar articles

Cited by

References

    1. Pitkanen A, Lukasiuk K. Mechanisms of epileptogenesis and potential treatment targets. Lancet Neurol. 2011;10:173–186. - PubMed
    1. DeFelipe J. Chandelier cells and epilepsy. Brain. 1999;122:1807–1822. - PubMed
    1. McNamara JO, Huang YZ, Leonard AS. Molecular signaling mechanisms underlying epileptogenesis. Sci STKE. 2006;2006:re12. - PubMed
    1. Wetherington J, Serrano G, Dingledine R. Astrocytes in the epileptic brain. Neuron. 2008;58:168–178. - PMC - PubMed
    1. Vezzani A, French J, Bartfai T, Baram TZ. The role of inflammation in epilepsy. Nat Rev Neurol. 2011;7:31–40. - PMC - PubMed

Publication types

MeSH terms