

Genome-wide association analysis identifies susceptibility loci for migraine without aura
- PMID: 22683712
- PMCID: PMC3773912
- DOI: 10.1038/ng.2307
Genome-wide association analysis identifies susceptibility loci for migraine without aura
Abstract
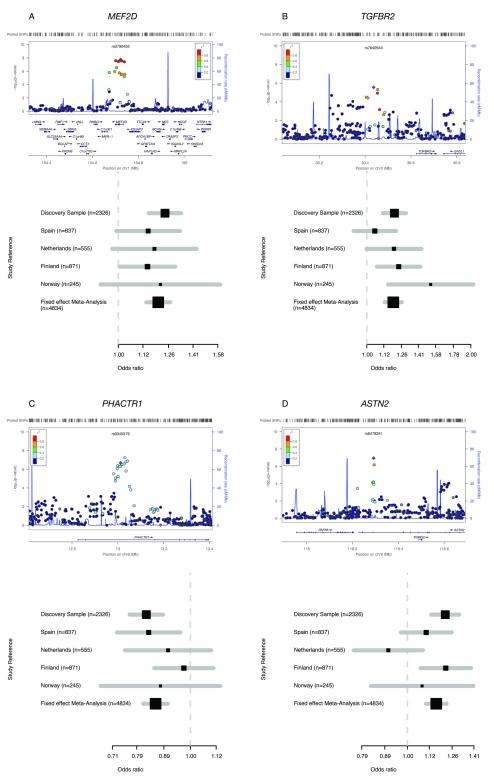
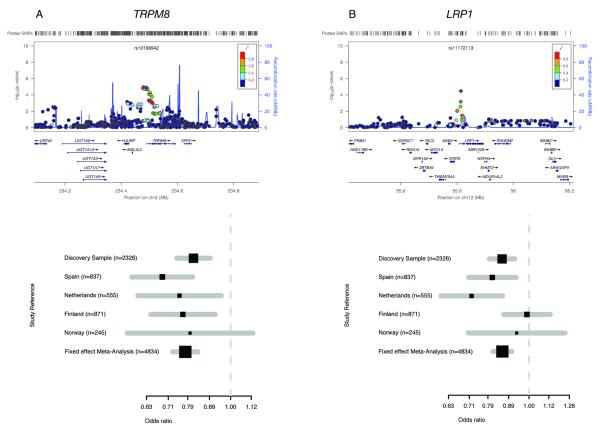
Migraine without aura is the most common form of migraine, characterized by recurrent disabling headache and associated autonomic symptoms. To identify common genetic variants associated with this migraine type, we analyzed genome-wide association data of 2,326 clinic-based German and Dutch individuals with migraine without aura and 4,580 population-matched controls. We selected SNPs from 12 loci with 2 or more SNPs associated with P values of <1 × 10(-5) for replication testing in 2,508 individuals with migraine without aura and 2,652 controls. SNPs at two of these loci showed convincing replication: at 1q22 (in MEF2D; replication P = 4.9 × 10(-4); combined P = 7.06 × 10(-11)) and at 3p24 (near TGFBR2; replication P = 1.0 × 10(-4); combined P = 1.17 × 10(-9)). In addition, SNPs at the PHACTR1 and ASTN2 loci showed suggestive evidence of replication (P = 0.01; combined P = 3.20 × 10(-8) and P = 0.02; combined P = 3.86 × 10(-8), respectively). We also replicated associations at two previously reported migraine loci in or near TRPM8 and LRP1. This study identifies the first susceptibility loci for migraine without aura, thereby expanding our knowledge of this debilitating neurological disorder.
Figures
Similar articles
-
Replication of migraine GWAS susceptibility loci in Chinese Han population.Headache. 2014 Apr;54(4):709-15. doi: 10.1111/head.12329. Epub 2014 Mar 25. Headache. 2014. PMID: 24666033
-
Replication and meta-analysis of common variants identifies a genome-wide significant locus in migraine.Eur J Neurol. 2013 May;20(5):765-72. doi: 10.1111/ene.12055. Epub 2013 Jan 7. Eur J Neurol. 2013. PMID: 23294458
-
Association between PRDM16, MEF2D, TRPM8, LRP1 gene polymorphisms and migraine susceptibility in the She ethnic population in China.Clin Invest Med. 2019 Mar 23;42(1):E21-E30. doi: 10.25011/cim.v42i1.32389. Clin Invest Med. 2019. PMID: 30904033
-
Genetics of migraine in the age of genome-wide association studies.J Headache Pain. 2012 Jan;13(1):1-9. doi: 10.1007/s10194-011-0399-0. Epub 2011 Nov 11. J Headache Pain. 2012. PMID: 22072275 Free PMC article. Review.
-
Deciphering the Role of the rs2651899, rs10166942, and rs11172113 Polymorphisms in Migraine: A Meta-Analysis.Medicina (Kaunas). 2022 Mar 29;58(4):491. doi: 10.3390/medicina58040491. Medicina (Kaunas). 2022. PMID: 35454329 Free PMC article. Review.
Cited by
-
Genes and primary headaches: discovering new potential therapeutic targets.J Headache Pain. 2013 Jul 12;14(1):61. doi: 10.1186/1129-2377-14-61. J Headache Pain. 2013. PMID: 23848401 Free PMC article. Review.
-
Fine-mapping a genome-wide meta-analysis of 98,374 migraine cases identifies 181 sets of candidate causal variants.medRxiv [Preprint]. 2024 May 20:2024.05.20.24307608. doi: 10.1101/2024.05.20.24307608. medRxiv. 2024. PMID: 39371129 Free PMC article. Preprint.
-
Epigenetic mechanisms in migraine: a promising avenue?BMC Med. 2013 Feb 4;11:26. doi: 10.1186/1741-7015-11-26. BMC Med. 2013. PMID: 23379668 Free PMC article. Review.
-
Quantitative assessment of the association between GRIA1 polymorphisms and migraine risk.Biosci Rep. 2018 Dec 14;38(6):BSR20181347. doi: 10.1042/BSR20181347. Print 2018 Dec 21. Biosci Rep. 2018. PMID: 30446525 Free PMC article.
-
Risk of Migraine in Europeans with Low Melanin Levels-A Population Based Case-Control Study.Brain Sci. 2022 May 10;12(5):620. doi: 10.3390/brainsci12050620. Brain Sci. 2022. PMID: 35625007 Free PMC article.
References
-
- Launer LJ, Terwindt GM, Ferrari MD. The prevalence and characteristics of migraine in a population-based cohort: the GEM study. Neurology. 1999;53:537–542. - PubMed
-
- Stovner LJ, Zwart JA, Hagen K, Terwindt GM, Pascual J. Epidemiology of headache in Europe. Eur. J. Neurol. 2006;13:333–345. - PubMed
-
- Stovner L, et al. The global burden of headache: a documentation of headache prevalence and disability worldwide. Cephalalgia. 2007;27:193–210. - PubMed
-
- Olesen J, Lekander I, Andlin-Sobocki P, Jönsson B. Funding of headache research in Europe. Cephalalgia. 2007;27:995–999. - PubMed
Publication types
MeSH terms
Substances
Grants and funding
LinkOut - more resources
Full Text Sources
Other Literature Sources
Miscellaneous
