Quantitative maps of protein phosphorylation sites across 14 different rat organs and tissues
- PMID: 22673903
- PMCID: PMC3621391
- DOI: 10.1038/ncomms1871
Quantitative maps of protein phosphorylation sites across 14 different rat organs and tissues
Abstract
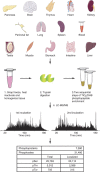
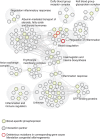
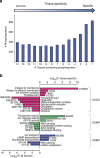
Deregulated cellular signalling is a common hallmark of disease, and delineating tissue phosphoproteomes is key to unravelling the underlying mechanisms. Here we present the broadest tissue catalogue of phosphoproteins to date, covering 31,480 phosphorylation sites on 7,280 proteins quantified across 14 rat organs and tissues. We provide the data set as an easily accessible resource via a web-based database, the CPR PTM Resource. A major fraction of the presented phosphorylation sites are tissue-specific and modulate protein interaction networks that are essential for the function of individual organs. For skeletal muscle, we find that phosphotyrosines are over-represented, which is mainly due to proteins involved in glycogenolysis and muscle contraction, a finding we validate in human skeletal muscle biopsies. Tyrosine phosphorylation is involved in both skeletal and cardiac muscle contraction, whereas glycogenolytic enzymes are tyrosine phosphorylated in skeletal muscle but not in the liver. The presented phosphoproteomic method is simple and rapid, making it applicable for screening of diseased tissue samples.
Figures


Similar articles
-
Novel tyrosine phosphorylation sites in rat skeletal muscle revealed by phosphopeptide enrichment and HPLC-ESI-MS/MS.J Proteomics. 2012 Jul 16;75(13):4017-26. doi: 10.1016/j.jprot.2012.05.009. Epub 2012 May 18. J Proteomics. 2012. PMID: 22609512 Free PMC article.
-
Growth hormone stimulates tyrosine phosphorylation of JAK2 and STAT5, but not insulin receptor substrate-1 or SHC proteins in liver and skeletal muscle of normal rats in vivo.Endocrinology. 1996 Jul;137(7):2880-6. doi: 10.1210/endo.137.7.8770909. Endocrinology. 1996. PMID: 8770909
-
Tissue specific phosphorylation of mitochondrial proteins isolated from rat liver, heart muscle, and skeletal muscle.J Proteome Res. 2013 Oct 4;12(10):4327-39. doi: 10.1021/pr400281r. Epub 2013 Sep 13. J Proteome Res. 2013. PMID: 23991683
-
A 60-kilodalton protein in rat hepatoma cells overexpressing insulin receptor was tyrosine phosphorylated and associated with Syp, phophatidylinositol 3-kinase, and Grb2 in an insulin-dependent manner.Endocrinology. 1996 Jul;137(7):2649-58. doi: 10.1210/endo.137.7.8770882. Endocrinology. 1996. PMID: 8770882
-
Insulin receptor substrate proteins create a link between the tyrosine phosphorylation cascade and the Ca2+-ATPases in muscle and heart.J Biol Chem. 1997 Sep 19;272(38):23696-702. doi: 10.1074/jbc.272.38.23696. J Biol Chem. 1997. PMID: 9295312
Cited by
-
Quantifying proteomes and their post-translational modifications by stable isotope label-based mass spectrometry.Curr Opin Chem Biol. 2013 Oct;17(5):779-86. doi: 10.1016/j.cbpa.2013.06.011. Epub 2013 Jul 5. Curr Opin Chem Biol. 2013. PMID: 23835517 Free PMC article. Review.
-
Modifications of Titin Contribute to the Progression of Cardiomyopathy and Represent a Therapeutic Target for Treatment of Heart Failure.J Clin Med. 2020 Aug 26;9(9):2770. doi: 10.3390/jcm9092770. J Clin Med. 2020. PMID: 32859027 Free PMC article. Review.
-
Proteoglycan profiling of human, rat and mouse insulin-secreting cells.Glycobiology. 2021 Sep 9;31(8):916-930. doi: 10.1093/glycob/cwab035. Glycobiology. 2021. PMID: 33997891 Free PMC article.
-
A homology-based pipeline for global prediction of post-translational modification sites.Sci Rep. 2016 May 13;6:25801. doi: 10.1038/srep25801. Sci Rep. 2016. PMID: 27174170 Free PMC article.
-
Label-free quantitative phosphoproteomics with novel pairwise abundance normalization reveals synergistic RAS and CIP2A signaling.Sci Rep. 2015 Aug 17;5:13099. doi: 10.1038/srep13099. Sci Rep. 2015. PMID: 26278961 Free PMC article.
References
-
- Schmelzle K. et al.. Temporal dynamics of tyrosine phosphorylation in insulin signaling. Diabetes 55, 2171 (2006). - PubMed
-
- Rhodes C. J. Type 2 diabetes-a matter of beta-cell life and death? Science 307, 380 (2005). - PubMed
-
- Vivanco I. & Sawyers C. L. The phosphatidylinositol 3-Kinase AKT pathway in human cancer. Nat. Rev. Cancer 2, 489 (2002). - PubMed
-
- Jope R. S. Anti-bipolar therapy: mechanism of action of lithium. Mol. Psychiatry 4, 117 (1999). - PubMed
-
- Perez J. et al.. Abnormalities of cAMP signaling in affective disorders: implication for pathophysiology and treatment. Bipolar Disord 2, 27 (2000). - PubMed
Publication types
MeSH terms
Substances
LinkOut - more resources
Full Text Sources
Other Literature Sources
Molecular Biology Databases

