. 2012 Jun 11;197(6):775-87.
doi: 10.1083/jcb.201201018. Epub 2012 Jun 4.

F-actin polymerization and retrograde flow drive sustained PLCγ1 signaling during T cell activation

Affiliations

F-actin polymerization and retrograde flow drive sustained PLCγ1 signaling during T cell activation

Alexander Babich et al. J Cell Biol. .

Abstract

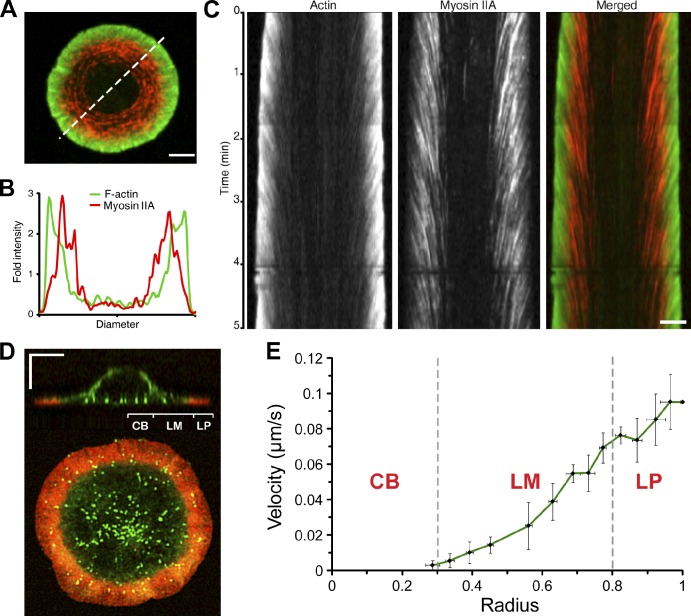
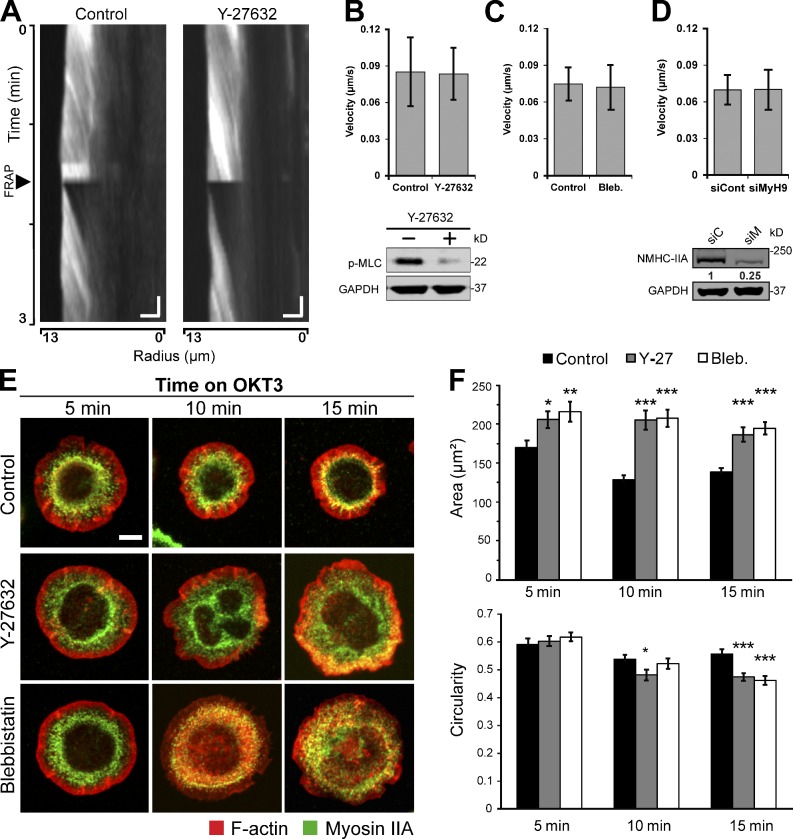
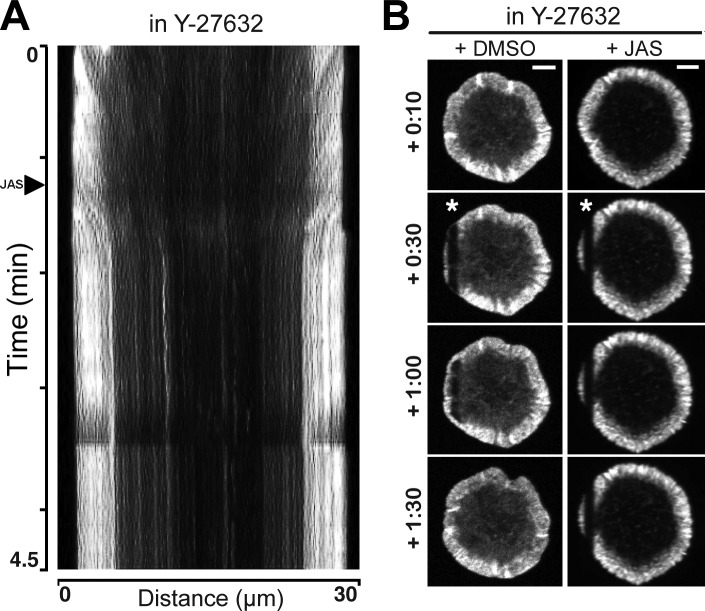
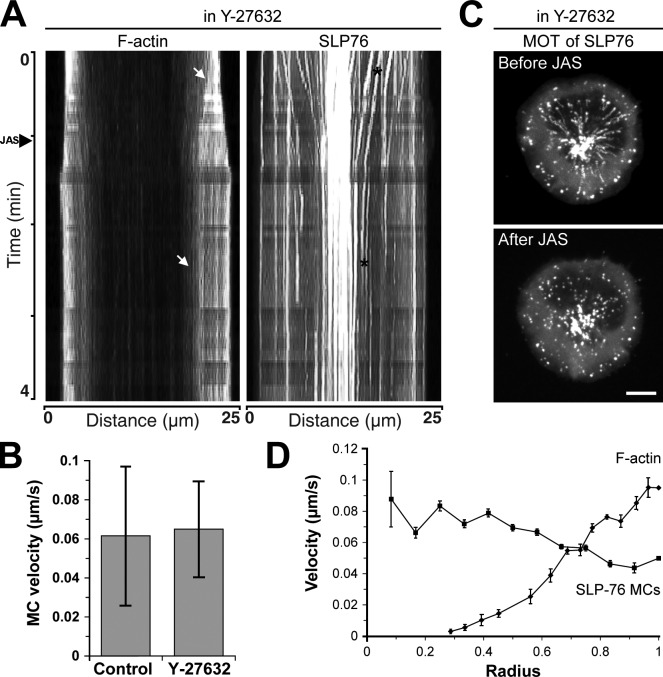
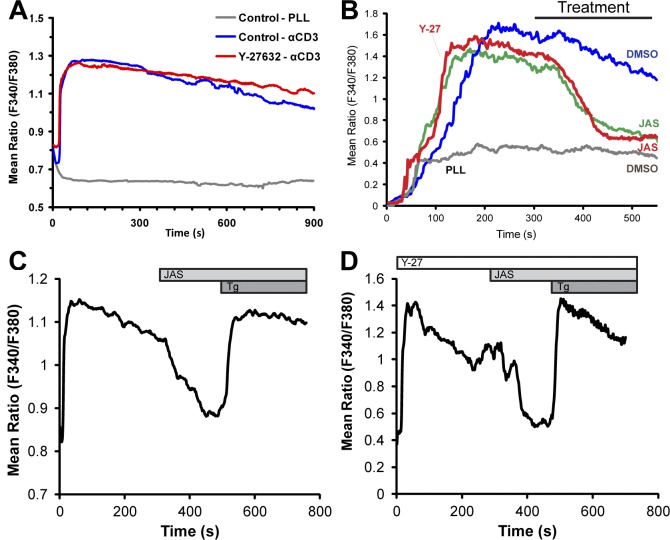
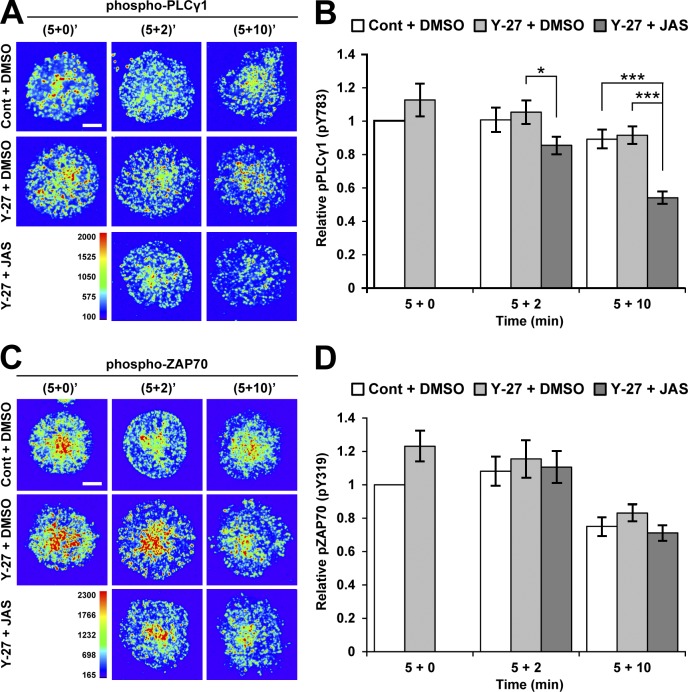
Activation of T cells by antigen-presenting cells involves assembly of signaling molecules into dynamic microclusters (MCs) within a specialized membrane domain termed the immunological synapse (IS). Actin and myosin IIA localize to the IS, and depletion of F-actin abrogates MC movement and T cell activation. However, the mechanisms that coordinate actomyosin dynamics and T cell receptor signaling are poorly understood. Using pharmacological inhibitors that perturb individual aspects of actomyosin dynamics without disassembling the network, we demonstrate that F-actin polymerization is the primary driver of actin retrograde flow, whereas myosin IIA promotes long-term integrity of the IS. Disruption of F-actin retrograde flow, but not myosin IIA contraction, arrested MC centralization and inhibited sustained Ca(2+) signaling at the level of endoplasmic reticulum store release. Furthermore, perturbation of retrograde flow inhibited PLCγ1 phosphorylation within MCs but left Zap70 activity intact. These studies highlight the importance of ongoing actin polymerization as a central driver of actomyosin retrograde flow, MC centralization, and sustained Ca(2+) signaling.


Figures

Figure 1.
Figure 1.
Distribution and dynamics of the T cell actomyosin network. (A) mKate2–NMHC II-A was transiently expressed in Jurkat T cells stably expressing GFP-actin. The cells were dropped on OKT3-coated coverglasses and imaged at a single focal plane every 3 s (also see Video 1). An image from a sequence is shown and is representative of four independent experiments. Bar, 5 µm. (B) The intensity profile of F-actin and myosin IIA was acquired along the dashed line in A. (C) A composite kymograph of actomyosin dynamics was acquired along the dashed line in A. Bar, 5 µm. (D) Jurkat T cells stably expressing GFP–SLP-76 (green) were stimulated as in A, fixed after 5 min, and stained for F-actin with phalloidin (red). Z stacks of whole cells were collected with a 0.25-µm step size and deconvolved using a calculated Point Spread Function in Volocity. A representative cell is shown in XZ and XY planes. Brackets represent 5 µm × 5 µm. (E) Kymographic analysis of F-actin features was compiled into a single graph to show the distribution of F-actin velocity across the IS radius. Mean ± SD is shown for each point (n = 13 cells). Similar results were obtained from three independent experiments.
Figure 2.
Figure 2.
F-actin stabilization leads to contraction of the actomyosin network. (A–C) Time-lapse series of T cells spreading on OKT3-coated coverslips. Arrowheads indicate times when 1 µM JAS was added. Bars, 10 µm. (A) Jurkat T cells stably expressing GFP-actin (see Video 4). (B) Primary human T cell blasts transiently transfected with GFP-actin (see Video 5). (C) E6.1 Jurkat T cells transiently transfected with GFP–NMHC II-A (see Video 6). (D and E) Kymographs of F-actin and myosin dynamics, generated along the dashed lines in A and C, respectively. Arrowheads indicate the addition of 1 µM JAS into the media. Brackets represent 10 µm × 1 min.
Figure 3.
Figure 3.
Myosin IIA is not required for F-actin flow but is necessary for long-term maintenance of the IS. (A) GFP-actin–expressing Jurkat T cells were pretreated for 15 min with vehicle or 25 µM Y-27632 and imaged while spreading on anti-CD3–coated coverslips. Kymographs were generated along the radii of fully spread cells. The arrowhead indicates the time when photobleaching of lamellipodia was induced. Brackets represent 2 µm × 15 s. (B, top) Analysis of velocities calculated from kymographs as in A (mean ± SD, n = 15 cells). (bottom) To verify inhibitory activity of Y-27632, Jurkat T cells were pretreated with Y-27632 as in A and stimulated with OKT3 (1 µg/ml) for 5 min. Cells were lysed and analyzed by Western blot analysis with antibodies to phosphorylated MLC (pMLC) or GAPDH. (C) Jurkat T cells were transiently transfected with F-tractin tdTomato and pretreated with 50 µM blebbistatin (Bleb.) or vehicle for 30 min. Actin retrograde flow was analyzed as in B. Values are mean ± SD of 80–90 kymographs from 14–20 cells. (D) GFP-actin–expressing Jurkat T cells were transfected with oligonucleotides specific for myosin IIA heavy chain (SiM) or control oligonucleotides (SiC) and cultured for 48 h, at which time suppression was found to be optimal. (top) Retrograde flow was analyzed as in B. (bottom) Lysates were analyzed by Western blotting to assess efficiency of suppression. Values represent relative NMHC II-A levels, normalized to GAPDH. (E) Jurkat T cells were untreated or pretreated with 25 µM Y-27632 or 50 µM blebbistatin and allowed to spread for the indicated times on anti-CD3–coated coverslips before fixation and labeling with phalloidin and anti–NMHC II-A. Bar, 5 µm. (F) Morphometric analysis of cells prepared as in E. Data represent mean ± SEM (n = 67–125 cells per condition). *, P < 0.05; **, P < 0.01; ***, P < 0.001. Similar results were obtained in two independent experiments.
Figure 4.
Figure 4.
Inhibition of myosin IIA and F-actin stabilization arrests retrograde flow. (A) A kymograph was generated along the diameter of a cell pretreated with 25 µM Y-27632 and spreading on OKT3-coated coverglasses. The arrowhead along the time axis indicates the addition of 1 µM JAS to the well. The kymograph was sharpened in Photoshop to accentuate F-actin features. (B) Time-lapse series of cells pretreated with 25 µM Y-27632 and allowed to interact with the stimulatory surface for 5 min before addition of either DMSO or 1 µM JAS. 30 s after the treatment, a portion of F-actin, marked with an asterisk, was photobleached, and fluorescence recovery was recorded. Bars, 5 µm.
Figure 5.
Figure 5.
F-actin governs MC dynamics but has different velocity distribution across the IS. (A) Kymographs were generated along the diameter of cells expressing GFP-actin and GFP–SLP-76 and sharpened in Photoshop as in Fig. S1 B. The arrowhead along the time axis indicates the addition of 1 µM JAS. Arrows in the kymograph of F-actin dynamics point to a feature that became immobilized upon addition of JAS. Asterisks in the kymograph of SLP-76 dynamics indicate an MC that was immobilized by addition of JAS. (B) Jurkat T cells expressing GFP–SLP-76 were pretreated with either vehicle control or Y-27632 and allowed to spread on OKT3-coated coverglasses. Velocities of SLP-76 MCs were analyzed by kymography (mean ± SD, n = 40–150 MCs from 10–19 cells). (C) Maximum-over-time (MOT) images of GFP–SLP-76 Jurkat T cells were compiled from the images acquired before or after the addition of JAS. Images are representative of three independent experiments. Bar, 10 µm. (D) Comparative analysis of SLP-76 MC centripetal velocity from a single cell overlaid with F-actin dynamics from Fig. 1 E. Mean ± SEM is shown.
Figure 6.
Figure 6.
Loss of F-actin dynamics abrogates sustained Ca2+ signaling by perturbing Ca2+ release from ER stores. (A) GFP-actin Jurkat T cells were pretreated with 25 µM Y-27632 or left untreated and loaded with fura-2 before plating on OKT3- or poly-l-lysine (PLL)–coated coverglasses in 2 mM Ca2+. (B) Cells were pretreated as in A and allowed to interact with the stimulatory surfaces for 5 min. DMSO or JAS was then added to the imaging chamber, and the response was measured for another 5 min. Similar results were obtained from three independent experiments. (C and D) Cells were pretreated as in B. 1 µM Tg was added to the dishes to induce Ca2+ release from ER stores.
Figure 7.
Figure 7.
F-actin immobilization selectively inhibits PLCγ1 phosphorylation. (A and C) GFP-actin Jurkat T cells were either pretreated with 25 µM Y-27632 (Y-27) or left untreated and plated on OKT3-coated coverglasses. After 5 min, cells were treated with DMSO or JAS, then fixed at the indicated times, and stained for phospho-Y783 of PLCγ1 (A) or phospho-Y319 of Zap70 (C). Intensity of antibody staining is pseudocolored. Cont, control. Bars, 5 µm. (B and D) Analysis of fluorescence intensities from phospho-PLCγ1 (A) or phospho-Zap70 (C) staining. The IS outlines were gauged by F-actin intensity; total phosphoprotein intensity per IS was calculated for a mean of 45 cells (B) or 35 cells (D) per condition. Mean ± SEM is shown. *, P < 0.05; ***, P < 0.001.

Similar articles

Cited by

References

    1. Alon R., Dustin M.L. 2007. Force as a facilitator of integrin conformational changes during leukocyte arrest on blood vessels and antigen-presenting cells. Immunity. 26:17–27 10.1016/j.immuni.2007.01.002 - DOI - PubMed
    1. Baker R.G., Hsu C.J., Lee D., Jordan M.S., Maltzman J.S., Hammer D.A., Baumgart T., Koretzky G.A. 2009. The adapter protein SLP-76 mediates “outside-in” integrin signaling and function in T cells. Mol. Cell. Biol. 29:5578–5589 10.1128/MCB.00283-09 - DOI - PMC - PubMed
    1. Beemiller P., Krummel M.F. 2010. Mediation of T-cell activation by actin meshworks. Cold Spring Harb. Perspect. Biol. 2:a002444 10.1101/cshperspect.a002444 - DOI - PMC - PubMed
    1. Bubb M.R., Senderowicz A.M., Sausville E.A., Duncan K.L., Korn E.D. 1994. Jasplakinolide, a cytotoxic natural product, induces actin polymerization and competitively inhibits the binding of phalloidin to F-actin. J. Biol. Chem. 269:14869–14871 - PubMed
    1. Bunnell S.C., Kapoor V., Trible R.P., Zhang W., Samelson L.E. 2001. Dynamic actin polymerization drives T cell receptor-induced spreading: A role for the signal transduction adaptor LAT. Immunity. 14:315–329 10.1016/S1074-7613(01)00112-1 - DOI - PubMed

Publication types