Kidney tumor biomarkers revealed by simultaneous multiple matrix metabolomics analysis
- PMID: 22628425
- PMCID: PMC3399039
- DOI: 10.1158/0008-5472.CAN-11-3105
Kidney tumor biomarkers revealed by simultaneous multiple matrix metabolomics analysis
Abstract
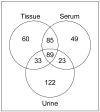
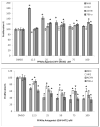
Metabolomics is increasingly being used in cancer biology for biomarker discovery and identification of potential novel therapeutic targets. However, a systematic metabolomics study of multiple biofluids to determine their interrelationships and to describe their use as tumor proxies is lacking. Using a mouse xenograft model of kidney cancer, characterized by subcapsular implantation of Caki-1 clear cell human kidney cancer cells, we examined tissue, serum, and urine all obtained simultaneously at baseline (urine) and at, or close to, animal sacrifice (urine, tissue, and plasma). Uniform metabolomics analysis of all three "matrices" was accomplished using gas chromatography- and liquid chromatography-mass spectrometry. Of all the metabolites identified (267 in tissue, 246 in serum, and 267 in urine), 89 were detected in all 3 matrices, and the majority was altered in the same direction. Heat maps of individual metabolites showed that alterations in serum were more closely related to tissue than was urine. Two metabolites, cinnamoylglycine and nicotinamide, were concordantly and significantly (when corrected for multiple testing) altered in tissue and serum, and cysteine-glutathione disulfide showed the highest change (232.4-fold in tissue) of any metabolite. On the basis of these and other considerations, three pathways were chosen for biologic validation of the metabolomic data, resulting in potential therapeutic target identification. These data show that serum metabolomics analysis is a more accurate proxy for tissue changes than urine and that tryptophan degradation (yielding anti-inflammatory metabolites) is highly represented in renal cell carcinoma, and support the concept that PPAR-α antagonism may be a potential therapeutic approach for this disease.
Figures


using raw p-values
using FDRs


Comment in
-
Kidney cancer: Metabolomics for targeted therapy.Nat Rev Urol. 2012 Jun 19;9(7):355. doi: 10.1038/nrurol.2012.127. Nat Rev Urol. 2012. PMID: 22710669 No abstract available.
Similar articles
-
Metabolomic study of human tissue and urine in clear cell renal carcinoma by LC-HRMS and PLS-DA.Anal Bioanal Chem. 2018 Jun;410(16):3859-3869. doi: 10.1007/s00216-018-1059-x. Epub 2018 Apr 16. Anal Bioanal Chem. 2018. PMID: 29658093 Free PMC article.
-
Urine metabolomics analysis for kidney cancer detection and biomarker discovery.Mol Cell Proteomics. 2009 Mar;8(3):558-70. doi: 10.1074/mcp.M800165-MCP200. Epub 2008 Nov 13. Mol Cell Proteomics. 2009. PMID: 19008263 Free PMC article.
-
Value of global metabolomics in association with diagnosis and clinicopathological factors of renal cell carcinoma.Int J Cancer. 2019 Jul 15;145(2):484-493. doi: 10.1002/ijc.32115. Epub 2019 Jan 24. Int J Cancer. 2019. PMID: 30628065
-
Metabolomics in renal cell carcinoma: From biomarker identification to pathomechanism insights.Arch Biochem Biophys. 2020 Nov 30;695:108623. doi: 10.1016/j.abb.2020.108623. Epub 2020 Oct 8. Arch Biochem Biophys. 2020. PMID: 33039388 Review.
-
Translational Metabolomics of Head Injury: Exploring Dysfunctional Cerebral Metabolism with Ex Vivo NMR Spectroscopy-Based Metabolite Quantification.In: Kobeissy FH, editor. Brain Neurotrauma: Molecular, Neuropsychological, and Rehabilitation Aspects. Boca Raton (FL): CRC Press/Taylor & Francis; 2015. Chapter 25. In: Kobeissy FH, editor. Brain Neurotrauma: Molecular, Neuropsychological, and Rehabilitation Aspects. Boca Raton (FL): CRC Press/Taylor & Francis; 2015. Chapter 25. PMID: 26269925 Free Books & Documents. Review.
Cited by
-
Novel drugs that target the metabolic reprogramming in renal cell cancer.Cancer Metab. 2016 Jul 13;4:14. doi: 10.1186/s40170-016-0154-8. eCollection 2016. Cancer Metab. 2016. PMID: 27418963 Free PMC article. Review.
-
Inhibition of PPARα induces cell cycle arrest and apoptosis, and synergizes with glycolysis inhibition in kidney cancer cells.PLoS One. 2013 Aug 7;8(8):e71115. doi: 10.1371/journal.pone.0071115. eCollection 2013. PLoS One. 2013. PMID: 23951092 Free PMC article.
-
The Nephrologist's Tumor: Basic Biology and Management of Renal Cell Carcinoma.J Am Soc Nephrol. 2016 Aug;27(8):2227-37. doi: 10.1681/ASN.2015121335. Epub 2016 Mar 9. J Am Soc Nephrol. 2016. PMID: 26961346 Free PMC article. Review.
-
HIF2α Promotes Cancer Metastasis through TCF7L2-Dependent Fatty Acid Synthesis in ccRCC.Research (Wash D C). 2024 Feb 22;7:0322. doi: 10.34133/research.0322. eCollection 2024. Research (Wash D C). 2024. PMID: 38390305 Free PMC article.
-
Novel methodologies in analysis of small molecule biomarkers and living cells.Tumour Biol. 2014 Oct;35(10):9469-77. doi: 10.1007/s13277-014-2439-2. Epub 2014 Aug 14. Tumour Biol. 2014. PMID: 25119591 Review.
References
-
- Bathe OF, Shaykhutdinov R, Kopciuk K, Weljie AM, McKay A, Sutherland FR, et al. Feasibility of identifying pancreatic cancer based on serum metabolomics. Cancer Epidemiol Biomarkers Prev. 2011;20:140–7. - PubMed
-
- Weiss RH, Kim K. Metabolomics in the study of kidney diseases. Nat Rev Nephrology. 2011;8:22–33. - PubMed
Publication types
MeSH terms
Substances
Grants and funding
LinkOut - more resources
Full Text Sources
Other Literature Sources
Medical

