. 2012 Jun 4;209(6):1219-34.
doi: 10.1084/jem.20111622. Epub 2012 May 21.

Pericytes support neutrophil subendothelial cell crawling and breaching of venular walls in vivo

Affiliations

Pericytes support neutrophil subendothelial cell crawling and breaching of venular walls in vivo

Doris Proebstl et al. J Exp Med. .

Abstract

Neutrophil transmigration through venular walls that are composed of endothelial cells (ECs), pericytes, and the venular basement membrane is a key component of innate immunity. Through direct analysis of leukocyte-pericyte interactions in inflamed tissues using confocal intravital microscopy, we show how pericytes facilitate transmigration in vivo. After EC migration, neutrophils crawl along pericyte processes to gaps between adjacent pericytes in an ICAM-1-, Mac-1-, and LFA-1-dependent manner. These gaps were enlarged in inflamed tissues through pericyte shape change and were used as exit points by neutrophils in breaching the venular wall. The findings identify previously unknown roles for pericytes in neutrophil transmigration in vivo and add additional steps to the leukocyte adhesion cascade that supports leukocyte trafficking into sites of inflammation.


Figures
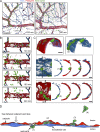
Figure 1.
Figure 1.
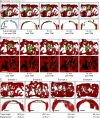
4D imaging of neutrophil transmigration. αSMA-RFPcherry ×Lys-EGFP-ki mice exhibiting endogenously labeled pericytes (RFPcherry, red) and neutrophils (EGFP, green) were subjected to EC junctional labeling using a directly conjugated Alexa Fluor 647 nonblocking mAb to PECAM-1 mAb (blue). (A) Composition of six 3D-reconstructed confocal images of the cremasteric microcirculation 120 and 240 min after intrascrotal injection of TNF. a, arteriole; c, capillary; cp, capillary pericyte; pcv, postcapillary venule. Bar, 100 µm. (B) Still images of a cremaster muscle postcapillary venule showing the development of an inflammatory reaction at the indicated time points after stimulation with TNF. Bar, 10 µm. (C) The images in the top panels are 3D reconstructions of half postcapillary venules showing a luminal neutrophil at an early stage of breaching the endothelium (cell 1) and a neutrophil that has already crossed the endothelium and is between the endothelium and pericyte layer (cell 2) at 3 h after TNF stimulation. The middle and bottom panels show the position of the indicated neutrophils from the luminal side (left hand side) or from 2-µm cross-sections of venules (right hand side) along the indicated lines demonstrating the position of the leukocyte relative to ECs and the pericyte layer. Bar, 10 µm. (D) Using the 3D real-time imaging model to analyze neutrophil transmigration through venular walls, several distinct steps were observed as illustrated in the diagram: (1) TEM, (2) motility between endothelium and the pericyte sheath (abluminal crawling), (3) migration through gaps between adjacent pericytes, and (4) interstitial migration. Images are representative of at least six separate experiments.
Figure 2.
Figure 2.
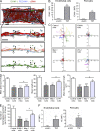
Analysis of neutrophil abluminal crawling in vivo. Cremaster muscles of αSMA-RFPcherry x Lys-EGFP-ki mice were stimulated with TNF for 2 h before being exteriorized and visualized by live confocal microscopy. (A) Time-lapse images showing a neutrophil (green) crawling along pericyte processes (red) from its site of TEM (i.e., starting point of the time course analysis, blue arrow) toward a gap between adjacent pericytes (red arrow). In the top panels, the neutrophil and pericyte layer are viewed from outside the vessel. The crawling path is shown with the yellow line. An isosurface mask was created to enable clearer visualization of the migrating neutrophil within the pericyte layer. In the bottom panels, 2-µm cross-sections in the z-axis show the position of the migrating neutrophil relative to the EC layer (blue) in the first image showing that it has passed the endothelium. The subsequent images show the neutrophil in relation to pericytes (red) during its abluminal crawling as captured at multiple time points. (B) Time-lapse images showing another example of neutrophil crawling along pericyte processes and avoiding the gaps between adjacent pericytes. Crawling path (yellow line) and directionality (black arrow) are shown in the top panels; the vessel segment is viewed in 3D from outside the vessel. The bottom panels show a higher magnification maximal intensity projection (2D) of the vessels with the shape of the neutrophil drawn with a green dotted line at each of the time points to illustrate its shape and its position relative to pericyte processes. (C) Four examples of postcapillary venules (pericyte in red) viewed in 3D from the extravascular space (top) or at a z-section angle (bottom), together with individual crawling paths (green line) and directionality (black arrow) of the neutrophil being tracked along pericyte processes in 3D. For clarity, the neutrophil being tracked is not depicted. Examples 1 and 2 show both the migration path and directionality of cells being tracked in A and B, respectively. All corresponding track and displacement lengths are given below the images. Bars, 10 µm.
Figure 3.
Figure 3.
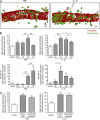
ICAM-1 and the integrins Mac-1 and LFA-1 mediate neutrophil–pericyte interactions. (A) Representative 3D-reconstructed confocal image of a TNF-stimulated (3 h) cremasteric postcapillary venule immunostained for PECAM-1 (EC, blue), ICAM-1 (green), and αSMA (Pericytes, red). The region within the box is enlarged in the images below following a longitudinal 2-µm cross-section of the vessel. In the middle panel of the enlarged region, a 4% opacity filter on the PECAM-1 and αSMA channels was applied to highlight ICAM-1 expression on the endothelium (arrow) and on the pericyte layer (arrowhead). The bottom panel shows only the ICAM-1 channel. Bars, 10 µm. (B) MFI per unit volume of ICAM-1 labeling on ECs and pericytes in unstimulated control and TNF-stimulated (3 h) tissues. (C) Effect of antibody blockade of ICAM-1, Mac-1, and LFA-1 on TNF-induced abluminal neutrophil crawling (after TEM) as observed in vivo in cremasteric postcapillary venules of using 4D confocal IVM. 2 h after intrascrotal injection of TNF in αSMA-RFPcherry x Lys-EGFP-ki mice (post-TEM migration), anti–ICAM-1, Mac-1, or LFA-1 blocking or isotype-matched control antibodies were injected i.s. for 30 min before cremasteric exteriorization. Crawling paths of abluminal neutrophils are shown (example of 20 per group for clarity) as normalized for their origins (sites of TEM). (D) Effect of anti–ICAM-1, Mac-1, and LFA-1 blocking antibodies on neutrophil abluminal crawling parameters as compared with control antibody-treated animals. The three graphs show the mean speed, total distance length, and displacement length of crawling. Data were obtained after analysis of a minimum of 211 crawling cells. (E) Number of extravasated neutrophils at 4 h after TNF stimulation of cremasteric muscles in animals treated with local injection of blocking anti–ICAM-1, Mac-1, and LFA-1 mAbs or isotope match control mAb. (F) MFI of KC staining per unit volume on ECs and pericytes in unstimulated control and TNF-stimulated (3 h) cremasteric venules. Results are expressed as mean of n = 4–5 vessels per mouse with at least 5 animals per group (A and B), 5–11 vessels from 4 animals (F), and from 1 vessel per animal with at least 6 animals/groups (C–E). Significant differences between groups are indicated by *, P < 0.05; **, P < 0.01; ***, P < 0.001. Significant differences between the anti–Mac-1 and anti–LFA-1 treated groups are indicated by # (P < 0.05).
Figure 4.
Figure 4.
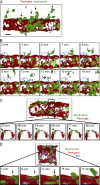
Migration of neutrophils through the pericyte sheath is site specific. (A) A representative 3D reconstructed image of TNF-stimulated cremasteric postcapillary venule from a αSMA-RFPcherry x Lys-EGFP-ki mouse (180 min after inflammation) illustrating the existence of sites in the venular wall that support the transmigration of multiple consecutive neutrophils (indicated by arrows). (B) Higher magnification images acquired at indicated time points illustrating the time course of migration of multiple neutrophils (labeled 1–6) through the same site within the pericyte layer (blue circles). The sequence of images initiates with the breaching of the pericyte layer by cell 1. (C and D) Two examples showing the ability of a neutrophil to exhibit hesitant transmigration through gaps in the pericyte sheath, i.e., exhibit multiple protrusions and/or oscillatory movements before finally breaching the pericyte layer from a TNF-stimulated cremaster muscle of an αSMA-RFPcherry x Lys-EGFP-ki mouse as observed by 4D confocal IVM. The top panels are images of a half cremasteric venule viewed from the luminal side (C) or extravascular space (D). The boxed regions show the transmigration of a neutrophil through the pericyte sheath at the indicated time points. The arrows indicate a neutrophil extending a protrusion toward the extravascular space that was then withdrawn once (C) or twice (D) after TEM before completing the extravasation response through the pericyte layer. All images are representative of at least n = 6 experiments (1 vessel/mouse, 1 mouse/experiment). Bar, 10 µm.
Figure 5.
Figure 5.
Neutrophils migrate through enlarged pericyte gaps. (A) The graph shows the frequency (percentage) of different sized gaps between adjacent pericytes in cremasteric postcapillary venules (unstimulated and TNF-stimulated) as detected by ex vivo immunofluorescence labeling and confocal microscopy. Gap sizes in the depicted range (1–52 µm2) represent ∼97% of all detected gaps (at least 4 venules per animal analyzed in 5 mice). The boxed region indicates the range of gaps used by ∼70% of observed transmigration events as analyzed by 4D confocal IVM (significantly different from the frequency of transmigration events detected in the nonboxed range; ***, P < 0.001). (B) Quantification of MFI per unit area of ICAM-1 (left) and KC (right) on pericyte cell body and at pericyte gap borders (a 2-µm wide region surrounding the gaps) after TNF-stimulation (3 h). Results are expressed as mean of at least n = 11 (A) and n = 5 (B) mice per group, respectively (with 3–4 vessels/cremaster, 2 cremasters/animal).
Figure 6.
Figure 6.
Effects of TNF and IL-1β on pericyte shape change in vivo. (A) WT mice were injected with either TNF or IL-1β for 2 or 4 h, respectively, into the cremaster muscle or intradermally in the ear. Tissues were then dissected away, fixed, and immunostained for the pericyte marker αSMA before being analyzed by confocal microscopy. Bars, 10 µm. (B) The graphs show the mean gap size between adjacent pericytes in unstimulated, TNF-, and IL-1β–stimulated venules of cremaster muscles (left) or the skin of the ear (right). Statistical significance between cytokine-stimulated tissues from the control group is indicated by asterisks. *, P < 0.05; ***, P < 0.001. Images are representative of n = 9 experiments (A) and results are expressed as mean of n = 7 mice per group (B; one mouse/experiment).
Figure 7.
Figure 7.
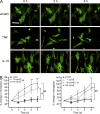
TNF and IL-1β stimulate shape change of pericyte-like C3H/10T1/2 cells in vitro. (A) Representative fluorescence time-lapse microscopy images of Lifeact-EGFP transfected C3H/10T1/2 cells are shown for the indicated time points after cytokine (2 and 4 h) or vehicle control (PBS, unstimulated group). The 0 h time point was captured before cytokine or PBS addition. Bar, 100 µm. (B) Graphs show the percentage change in cell elongation over time in response to different concentrations of TNF (left) or IL-1β (right). Data were obtained after analysis of a minimum of seven independent experiments. Statistical significance between each time point after stimulation and the unstimulated condition (0 h time point) are indicated by asterisks. *, P < 0.05; **, P < 0.01; ***, P < 0.001. Statistical significances between cytokine-stimulated (4 h) conditions and PBS-treated groups are indicated by hash symbols. #, P < 0.05; ##, P < 0.01. Images and results are from n = 5 experiments.
Figure 8.
Figure 8.
Cytokine-induced pericyte shape change can occur in a neutrophil-independent manner. TNF or IL-1β were injected i.s. into WT C57BL/6 mice and cremaster muscles were dissected at different time points after stimulation, fixed, immunostained for pericytes (αSMA, red) and neutrophils (MRP-14, green) and analyzed by confocal microscopy. (A) Representative images from TNF- (left) and IL-1β–stimulated (right) cremasteric venules illustrating the neutrophil infiltration responses obtained at the 4-h time point. Bars, 10 µm. (B) Time course of cytokine-induced increase in mean gap size between adjacent pericytes (top) and neutrophil transmigration (bottom) in response to TNF- (left) and IL-1β–(right). Statistically significant cytokine-induced responses, as compared with responses noted in unstimulated tissues, are indicated by *asterisks. *, P < 0.05; **, P < 0.01; ***, P < 0.001. Significant differences between responses at different time points are indicated by hash symbols. #, P < 0.05; ##, P < 0.01; ###, P < 0.001. (C) WT mice were depleted of their circulating neutrophils using an anti-GR1 antibody (100 µg, i.p.) 24 h before i.s. injection of TNF or IL-1β. Control mice were treated with an isotype control antibody. Mean size of pericyte gaps was quantified at 2 h (TNF) or 4 h (IL-1β) after stimulation. Significant differences from unstimulated controls are indicated by asterisks. *, P < 0.05; ***, P < 0.001. n = 3–4 experiments for (at least 4 vessels analyzed per animal per experiment).
Figure 9.
Figure 9.
Pericytes express receptors for TNF and IL-1β. (A) The panels show a 3D-reconstruced postcapillary venule of an unstimulated cremaster muscle immunostained for PECAM-1 (EC junction, blue), αSMA (pericytes, red), and the cytokine receptor of interest (green) or with an isotype control antibody (top). A 1-µm-thick section of the dotted boxed region is enlarged below highlighting the specific expression of TNFRI, TNFRII, and IL-1RI on both ECs (black arrows) and pericytes (arrowhead). Bars, 10 µm. (B) Graphs show the MFI of TNFRI-, TNFRII-, or IL-RI–specific staining on ECs (left) and pericytes (right) as determined by IMARIS software. Significant expression of the cytokine receptors as compared with the binding of an isotype control antibody (Student’s t test) is indicated by asterisks. ***, P < 0.001. (C) Representative flow cytometry histograms illustrate the presence of TNFRI, TNFRII, and IL-1RI on C3H/10T1/2 cells in vitro. Binding of isotype control antibodies (back lines) and primary mAbs directed against cytokine receptors (blue line) are shown as overlays. The graph (bottom right) shows mean RFIs for TNFRI, TNFRII, and IL-1RI. The dotted line indicates the isotype control RFI. Significant differences compared with the isotype control (Student’s t test) are indicated by asterisks. *, P < 0.05; ***, P < 0.001. Representative images and results are from n = 4 mice (A and B; at least 3 vessels per mouse) and 6 (C) experiments.

Similar articles

Cited by

References

    1. Alexopoulou A.N., Couchman J.R., Whiteford J.R. 2008. The CMV early enhancer/chicken beta actin (CAG) promoter can be used to drive transgene expression during the differentiation of murine embryonic stem cells into vascular progenitors. BMC Cell Biol. 9:2 10.1186/1471-2121-9-2 - DOI - PMC - PubMed
    1. Armulik A., Abramsson A., Betsholtz C. 2005. Endothelial/pericyte interactions. Circ. Res. 97:512–523 10.1161/01.RES.0000182903.16652.d7 - DOI - PubMed
    1. Burns A.R., Walker D.C., Brown E.S., Thurmon L.T., Bowden R.A., Keese C.R., Simon S.I., Entman M.L., Smith C.W. 1997. Neutrophil transendothelial migration is independent of tight junctions and occurs preferentially at tricellular corners. J. Immunol. 159:2893–2903 - PubMed
    1. Christofidou-Solomidou M., Nakada M.T., Williams J., Muller W.A., DeLisser H.M. 1997. Neutrophil platelet endothelial cell adhesion molecule-1 participates in neutrophil recruitment at inflammatory sites and is down-regulated after leukocyte extravasation. J. Immunol. 158:4872–4878 - PubMed
    1. Cohen M.P., Frank R.N., Khalifa A.A. 1980. Collagen production by cultured retinal capillary pericytes. Invest. Ophthalmol. Vis. Sci. 19:90–94 - PubMed

Publication types

MeSH terms