. 2012 Aug;22(8):1227-45.
doi: 10.1038/cr.2012.82. Epub 2012 May 22.

Determination of synthetic lethal interactions in KRAS oncogene-dependent cancer cells reveals novel therapeutic targeting strategies

Affiliations

Determination of synthetic lethal interactions in KRAS oncogene-dependent cancer cells reveals novel therapeutic targeting strategies

Michael Steckel et al. Cell Res. 2012 Aug.

Abstract

Oncogenic mutations in RAS genes are very common in human cancer, resulting in cells with well-characterized selective advantages, but also less well-understood vulnerabilities. We have carried out a large-scale loss-of-function screen to identify genes that are required by KRAS-transformed colon cancer cells, but not by derivatives lacking this oncogene. Top-scoring genes were then tested in a larger panel of KRAS mutant and wild-type cancer cells. Cancer cells expressing oncogenic KRAS were found to be highly dependent on the transcription factor GATA2 and the DNA replication initiation regulator CDC6. Extending this analysis using a collection of drugs with known targets, we found that cancer cells with mutant KRAS showed selective addiction to proteasome function, as well as synthetic lethality with topoisomerase inhibition. Combination targeting of these functions caused improved killing of KRAS mutant cells relative to wild-type cells. These observations suggest novel targets and new ways of combining existing therapies for optimal effect in RAS mutant cancers, which are traditionally seen as being highly refractory to therapy.


Figures
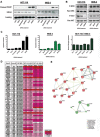
Figure 1
Figure 1
Effects of KRAS knockdown in the isogenic cell line pair and validated top hits from the large-scale KRAS differential apoptosis screen. (A) Strong apoptosis induction assessed by PARP cleavage in the KRAS mutant cell line HCT-116 as compared to an attenuated response in HKE-3 cells. Non-targeting “Scrambled” and GAPDH siRNAs serve as negative controls and knockdown of PLK1 exhibits strong apoptosis induction in both cell lines. (B) Knockdown of KRAS results in reduced levels of phospho-ERK and phospho-AKT in the KRAS mutant cell line. (C) Reproduction of the results shown in A by duplexed fluorescence microplate assay. Apoptosis induction in HCT-116 and HKE-3 is shown for the panel of control siRNAs shown in A. Calculation of an apoptosis ratio between the isogenic cell lines provides a measure of the much stronger induction of apoptosis in HCT-116 as compared to HKE-3. Data are represented as mean ± SD. (D) Validated top siRNA primary screen hits. Tabulated mean differential apoptosis-induction data from six independent validation experiments using the original siRNA pools to compare HCT-116 with HKE-3 cells together with complementary data from four independent validation experiments comparing HCT-116 with HKH-2 cells. Only three genes failed to validate across the alternative isogenic cell line comparison. Data are represented as mean ± SD. (E) STRING plot showing predicted protein-protein interactions among the top 52 hits.
Figure 2
Figure 2
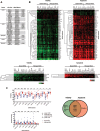
Use of a cell line panel for secondary screening of KRAS selective hits. (A) Cell line panel used in a secondary screen with siRNAs targeting the validated 52 genes identified by the primary screen together with a panel of control siRNAs: 14 KRAS mutant and 14 KRAS wild-type cell lines from various cancer types. (B) Hierarchical cluster analysis of both viability and apoptosis assays. Negative controls cluster closely together, as do strong pan-positive controls such as UBB/UBC and PLK1/NDC80. KRAS clusters tightly with a small set of genes including GATA2. (C) Unpaired t-test analysis of both viability and apoptosis datasets to identify genes whose knockdown has a statistically significant differential effect in KRAS mutant versus KRAS wild-type cells. In addition to KRAS, significant differences are found for a total of ten genes, four of which are common to both viability and apoptosis datasets.
Figure 3
Figure 3
CDC6 knockdown leads to increased DNA damage in RAS mutant cells. (A) CDC6 knockdown for 48 h leads to loss of S phase cells in both HCT-116 KRAS mutant and HKE-3 KRAS wild-type cells, as assessed by flow cytometry. CDC6-depleted HCT-116 cells also exhibit an increase in the proportion of G2/M phase cells that is not evident in CDC6-depleted HKE-3. Non-targeting “Risc-free” siRNA serves as a negative control. (B) A pulse of BrdU, used to label S phase cells after a 48-h CDC6 depletion, followed by a 6-h chase, indicates that whereas HKE-3 cells are stably arrested, HCT-116 cells continue to move through S phase. Non-targeting “Risc-free” siRNA serves as a negative control to monitor the normal S phase traverse of each cell line over the same time period. (C) Strong induction of DNA damage assessed by γH2AX, p53 and p21 accumulation in response to depletion of CDC6 over two and three days in HCT-116 as compared to an attenuated response in HKE-3 cells. Non-targeting “Risc-free” siRNA serves as a negative control. (D) In contrast to GATA2 knockdown, CDC6 knockdown produces no synergistic synthetic lethal pro-apoptotic effect when combined with proteasome inhibition. 24 h after siRNA transfection cells were treated with a wide titration range of the proteasome inhibitor bortezomib and apoptosis induction was measured 24 h later.
Figure 4
Figure 4
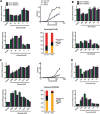
Differential killing of mutant RAS cells by proteasome inhibitors and by topoisomerase inhibitors. (A) Bortezomib preferentially impairs viability of HCT-116 as compared to HKE-3 or HKH-2 cells across a wide range of drug concentration (top left panel). Parallel differential apoptosis induction can also be monitored, indicated by apoptosis ratios (bottom left panel) and apoptosis-induction data for individual cell lines (top right panel – relative to control vehicle treatment). Data are represented as mean ± SD. FACS analysis to monitor annexin V staining following bortezomib treatment shows preferential induction of cell death in HCT-116 cells (bottom right panel). (B) An alternative proteasome inhibitor (MG-132) also produces a preferential viability loss in HCT-116 as compared to HKE-3 or HKH-2 cells across a wide range of drug concentrations (top panel). Parallel differential apoptosis induction is indicated by apoptosis ratios (bottom panel). (C) Topotecan preferentially impairs viability of HCT-116 as compared to HKE-3 or HKH-2 cells across a wide range of drug concentration (top left panel). Parallel differential apoptosis induction can also be monitored, indicated by apoptosis ratios (bottom left panel) and apoptosis-induction data for individual cell lines (top right panel – relative to control vehicle treatment). Data are represented as mean ± SD. FACS analysis to monitor annexin V staining following topotecan treatment shows preferential induction of cell death in HCT-116 cells (bottom right panel). (D) An alternative topoisomerase inhibitor (doxorubicin) also produces a preferential viability loss in HCT-116 as compared to HKE-3 or HKH-2 cells across a wide range of drug concentrations (top panel). Parallel differential apoptosis induction is indicated by apoptosis ratios (bottom panel).
Figure 5
Figure 5
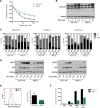
Analysis of the effects of proteasome and topoisomerase inhibition on RAS mutant and wild-type cells. (A) Steady-state chymotrypsin-like proteasome activity is more strongly inhibited in HCT-116 as compared to HKE-3 cells across a titration range of bortezomib. 24 h after seeding, cells were treated with bortezomib for 90 min before exposure to luminogenic substrate for 15 min. Data are represented as mean ± SD. (B) 24-h bortezomib treatment leads to a pronounced accumulation of ubiquitinated proteins at lower drug doses in HCT-116 as compared to HKE-3 cells. (C) Treatment of HCT-116 cells with a range of doses of bortezomib or topoisomerase inhibitors for 24 h leads to a stronger G2/M arrest when compared with HKE-3 cells, as assessed by flow cytometry. (D) 24-h treatment with a range of doses of topoisomerase inhibitors used in C leads to a more pronounced DNA damage response in HCT-116 when compared with HKE-3 cells, as monitored by γH2AX and p53 accumulation. (E) Steady-state ROS levels are elevated in HCT-116 cells as compared to HKE-3 counterparts, as determined by flow cytometry. (F) Topoisomerase inhibition for 24 h, using 600 nM topotecan, further increases ROS levels in both HCT-116 and HKE-3 cells, as determined by flow cytometry. Hydrogen peroxide treatment for 90 min serves as a positive control to assess the response of each cell line to oxidative stress.
Figure 6
Figure 6
Inducible oncogenic RAS signaling sensitizes cells to topoisomerase inhibition. (A) In contrast to the comparison between HCT-116 and HKE-3 cells, 4-hydroxy-tamoxifen-inducible oncogenic RAS in an HKE-3 cell background does not confer preferential induction of apoptosis in response to bortezomib treatment (left panel). Conversely, topotecan treatment does still elicit a clear differential apoptosis response when RAS-induced cells are compared to uninduced cells (right panel). Data are relative to control vehicle-treated cells and are represented as mean ± SD. (B) Ratio of apoptosis induced in mutant versus wild-type or ER-RAS-induced versus uninduced cells treated with bortezomib or topotecan (left panel). HKE-3 cells carrying a 4-hydroxy-tamoxifen-inducible oncogenic RAS construct fail to show a preferential induction of apoptosis following treatment with two additional proteasome inhibitors (MG-132 and PI-I) when comparing RAS-induced with uninduced cells. Conversely, treatment with two alternative topoisomerase inhibitors (doxorubicin and camptothecin) still results in a strong preferential induction of apoptosis when comparing RAS-induced with uninduced cells (right panel). (C) Modulation of inducible ER-RAS fusion protein activity, by titration of 4-hydroxy-tamoxifen, shows a gradual decline in apoptosis induction upon treatment with a wide range of camptothecin concentrations to baseline uninduced levels. Differential apoptosis induction is represented by plotting the induced/uninduced ratio. Data are represented as mean ± SD. (D) 24 h induction of oncogenic RAS signaling produces an increase in ROS levels that is elevated further in response to topotecan treatment.
Figure 7
Figure 7
Drug combinations enhance killing of mutant RAS cells. (A) The combination of low (sub-lethal) doses of bortezomib and topotecan leads to a preferential loss of viability in HCT-116 as compared to HKE-3 cells. These effects can be seen across a wide topotecan titration range in combination with several bortezomib concentrations (left panel). Selected viability ratios are displayed (middle panel) and parallel differential apoptosis induction can also be monitored, indicated by apoptosis ratios (right panel). Data are represented as mean ± SD. (B) Different scheduling of drug treatment influences the effect of drug combinations: Adding bortezomib together with topotecan results in an elevated apoptosis induction in HCT-116 cells in comparison to HKE-3 cells as shown in A. The addition of bortezomib for 24 h prior to topotecan treatment does not elicit this response whereas addition of proteasome inhibitor 24 h post induction of DNA damage leads to an even greater differential effect. Apoptosis induction in the individual cell lines is displayed (left panel) and differential apoptosis induction is indicated by apoptosis ratios (right panel). Data are represented as mean ± SD. (C) Enhanced differential apoptosis induction effects can also be produced in response to scheduling the combination of gemcitabine and bortezomib. Selected apoptosis ratios are displayed. Data are represented as mean ± SD. (D) The application of low doses of bortezomib 24 h post induction of DNA damage can enhance the preferential loss of viability in KRAS mutant lung cancer cells as compared to KRAS wild-type cells. These effects can be seen across a wide doxorubicin titration range in combination with several bortezomib concentrations (curves representing the ratios of average values for each KRAS genotype, left panel; single data points representing individual cell lines, middle and right panels).

Similar articles

Cited by

References

    1. Downward J. Targeting RAS signalling pathways in cancer therapy. Nat Rev Cancer. 2003;3:11–22. - PubMed
    1. Shirasawa S, Furuse M, Yokoyama N, Sasazuki T. Altered growth of human colon cancer cell lines disrupted at activated Ki-ras. Science. 1993;260:85–88. - PubMed
    1. Chin L, Tam A, Pomerantz J, et al. Essential role for oncogenic Ras in tumour maintenance. Nature. 1999;400:468–472. - PubMed
    1. Sharma SV, Gajowniczek P, Way IP, et al. A common signaling cascade may underlie “addiction” to the Src, BCR-ABL, and EGF receptor oncogenes. Cancer Cell. 2006;10:425–435. - PMC - PubMed
    1. Weir B, Zhao X, Meyerson M. Somatic alterations in the human cancer genome. Cancer Cell. 2004;6:433–438. - PubMed

Publication types

MeSH terms

Substances