

Genome-wide gene amplification during differentiation of neural progenitor cells in vitro
- PMID: 22606362
- PMCID: PMC3351388
- DOI: 10.1371/journal.pone.0037422
Genome-wide gene amplification during differentiation of neural progenitor cells in vitro
Abstract
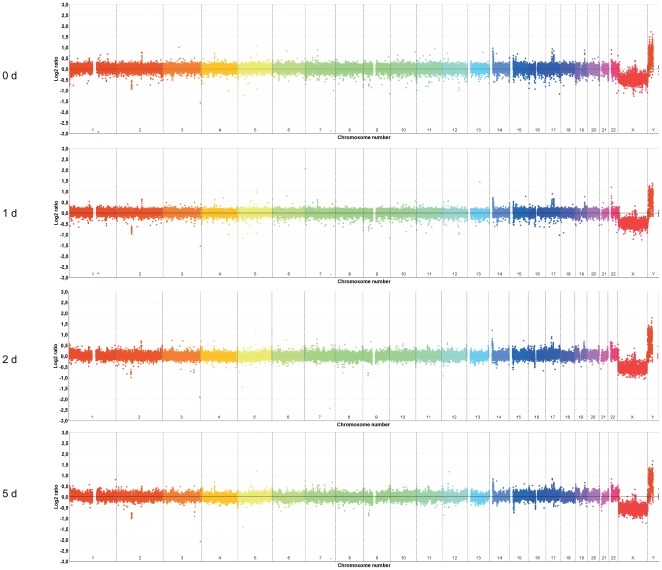
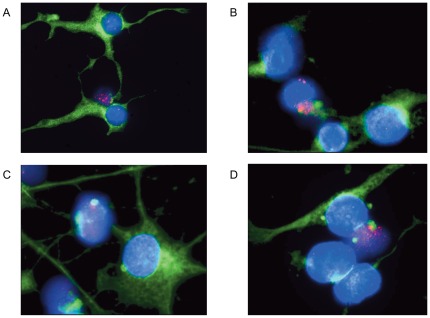
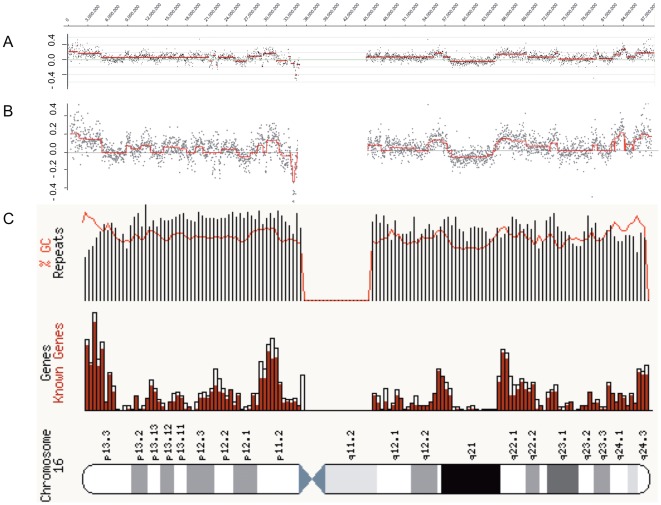
DNA sequence amplification is a phenomenon that occurs predictably at defined stages during normal development in some organisms. Developmental gene amplification was first described in amphibians during gametogenesis and has not yet been described in humans. To date gene amplification in humans is a hallmark of many tumors. We used array-CGH (comparative genomic hybridization) and FISH (fluorescence in situ hybridization) to discover gene amplifications during in vitro differentiation of human neural progenitor cells. Here we report a complex gene amplification pattern two and five days after induction of differentiation of human neural progenitor cells. We identified several amplified genes in neural progenitor cells that are known to be amplified in malignant tumors. There is also a striking overlap of amplified chromosomal regions between differentiating neural progenitor cells and malignant tumor cells derived from astrocytes. Gene amplifications in normal human cells as physiological process has not been reported yet and may bear resemblance to developmental gene amplifications in amphibians and insects.
Conflict of interest statement
Figures


Similar articles
-
Gene amplification during differentiation of mammalian neural stem cells in vitro and in vivo.Oncotarget. 2015 Mar 30;6(9):7023-39. doi: 10.18632/oncotarget.3248. Oncotarget. 2015. PMID: 25760141 Free PMC article.
-
Specific amplifications and copy number decreases during human neural stem cells differentiation towards astrocytes, neurons and oligodendrocytes.Oncotarget. 2017 Apr 18;8(16):25872-25884. doi: 10.18632/oncotarget.15980. Oncotarget. 2017. PMID: 28415661 Free PMC article.
-
Genome-wide copy number profiling to detect gene amplifications in neural progenitor cells.Genom Data. 2014 Jun 28;2:162-5. doi: 10.1016/j.gdata.2014.06.020. eCollection 2014 Dec. Genom Data. 2014. PMID: 26484086 Free PMC article.
-
High-resolution analysis of genetic events in cancer cells using bacterial artificial chromosome arrays and comparative genome hybridization.Adv Cancer Res. 2003;90:91-125. doi: 10.1016/s0065-230x(03)90003-0. Adv Cancer Res. 2003. PMID: 14710948 Review.
-
Comparative genomic hybridization: a rapid new method for detecting and mapping DNA amplification in tumors.Semin Cancer Biol. 1993 Feb;4(1):41-6. Semin Cancer Biol. 1993. PMID: 8448377 Review.
Cited by
-
Gene amplification during differentiation of mammalian neural stem cells in vitro and in vivo.Oncotarget. 2015 Mar 30;6(9):7023-39. doi: 10.18632/oncotarget.3248. Oncotarget. 2015. PMID: 25760141 Free PMC article.
-
A Mechanism Leading to Changes in Copy Number Variations Affected by Transcriptional Level Might Be Involved in Evolution, Embryonic Development, Senescence, and Oncogenesis Mediated by Retrotransposons.Front Cell Dev Biol. 2021 Feb 11;9:618113. doi: 10.3389/fcell.2021.618113. eCollection 2021. Front Cell Dev Biol. 2021. PMID: 33644055 Free PMC article.
-
Gene amplification during myogenic differentiation.Oncotarget. 2016 Feb 9;7(6):6864-77. doi: 10.18632/oncotarget.6845. Oncotarget. 2016. PMID: 26760505 Free PMC article.
-
Ketamine promotes the neural differentiation of mouse embryonic stem cells by activating mTOR.Mol Med Rep. 2020 Jun;21(6):2443-2451. doi: 10.3892/mmr.2020.11043. Epub 2020 Mar 30. Mol Med Rep. 2020. PMID: 32236601 Free PMC article.
-
A Temporary Pause in the Replication Licensing Restriction Leads to Rereplication during Early Human Cell Differentiation.Cells. 2022 Mar 21;11(6):1060. doi: 10.3390/cells11061060. Cells. 2022. PMID: 35326512 Free PMC article.
References
-
- Bostock CJ. Mechanisms of DNA sequence amplification and their evolutionary consequences. Philos Trans R Soc Lond B Biol Sci. 1986;312:261–273. - PubMed
-
- Tower J. Developmental gene amplification and origin regulation. Annu Rev Genet. 2004;38:273–304. - PubMed
-
- Graves JA. Gene amplification in a mouse embryo? Double minutes in cell lines independently derived from a Mus musculus X M. caroli fetus. Chromosoma. 1984;89:138–142. - PubMed
Publication types
MeSH terms
LinkOut - more resources
Full Text Sources
Other Literature Sources
Molecular Biology Databases
