. 2012 Jul 6;287(28):23790-807.
doi: 10.1074/jbc.M112.361550. Epub 2012 May 17.

Structural basis for the acyltransferase activity of lecithin:retinol acyltransferase-like proteins

Affiliations

Structural basis for the acyltransferase activity of lecithin:retinol acyltransferase-like proteins

Marcin Golczak et al. J Biol Chem. .

Abstract

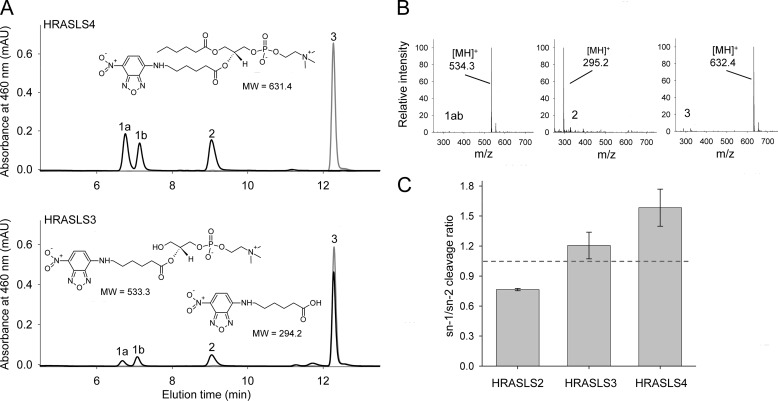
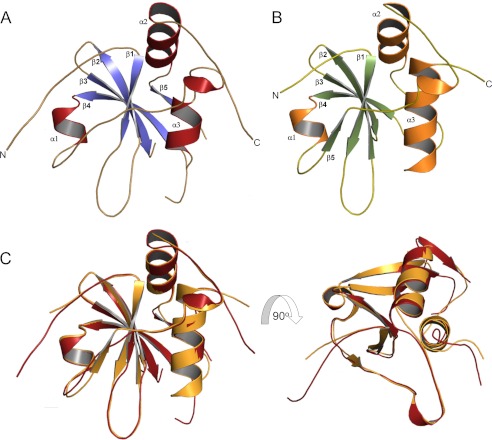
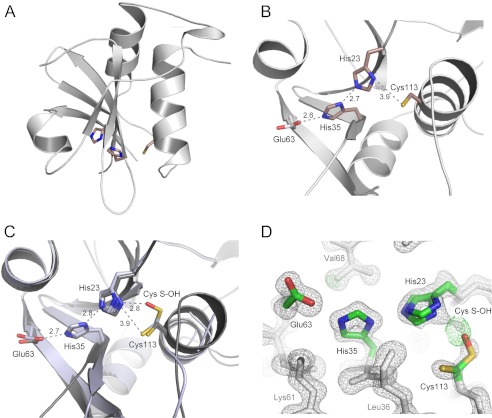
Lecithin:retinol acyltransferase-like proteins, also referred to as HRAS-like tumor suppressors, comprise a vertebrate subfamily of papain-like or NlpC/P60 thiol proteases that function as phospholipid-metabolizing enzymes. HRAS-like tumor suppressor 3, a representative member of this group, plays a key role in regulating triglyceride accumulation and energy expenditure in adipocytes and therefore constitutes a novel pharmacological target for treatment of metabolic disorders causing obesity. Here, we delineate a catalytic mechanism common to lecithin:retinol acyltransferase-like proteins and provide evidence for their alternative robust lipid-dependent acyltransferase enzymatic activity. We also determined high resolution crystal structures of HRAS-like tumor suppressor 2 and 3 to gain insight into their active site architecture. Based on this structural analysis, two conformational states of the catalytic Cys-113 were identified that differ in reactivity and thus could define the catalytic properties of these two proteins. Finally, these structures provide a model for the topology of these enzymes and allow identification of the protein-lipid bilayer interface. This study contributes to the enzymatic and structural understanding of HRAS-like tumor suppressor enzymes.


Figures

FIGURE 1.
FIGURE 1.
Sequence alignment and purification of LRAT-like protein members. A, sequences of human HRASLS1–5 and LRAT were aligned by using ClustalW2 available at the EMBL-EBI server. Conserved and homologous residues are shown with yellow and green backgrounds, respectively. The conserved His residues and six amino acid stretches containing the catalytic Cys residue are highlighted in red. The predicted C-terminal transmembrane segments are marked with a gray background. B, SDS-PAGE mobility of purified HRASLS proteins. Two μg of each protein were separated in a 15% gel and stained with Coomassie Blue R-250. Single protein bands indicate the high purity of protein preparations. C, schematic representations of truncated C-terminal His6-tagged HRASLS1–4 expressed in E. coli.
FIGURE 2.
FIGURE 2.
Self-acylation of HRASLS3 in the presence of PC. Ten μg of HRASLS3 was incubated with 0.5 mm 7:0–7:0 PC in 10 mm Tris-HCl, pH 8.0, 1 mm DTT for 10 min at 25 °C. The mixture was then analyzed by LC/MS. A, HPLC separation and MS spectra of the protein and the lipid substrate. Peaks 1a and 1b represent intact protein and its acyl modified form, respectively. Peak 2 corresponds to 7:0–7:0 PC. The MS spectrum, shown in the lower panel, displays a selected group of multiply charged protein ions for the unmodified and acylated protein. Deconvolution of the HRASLS3 spectrum reveals a protein mass of 15,871 Da, which is identical to the theoretical mass of the recombinant His6-tagged protein. Incubation of this protein with 7:0–7:0 PC led to a 112-Da shift in the experimentally obtained protein mass as calculated from the additional series of ions labeled in red. This mass difference matches a heptanoic acid moiety carried by the lipid substrate. B, determination of the acylation site by tandem MS. A pepsin digest of HRASLS3 after incubation with 7:0–7:0 PC revealed a +1 peptide (m/z = 1103.5), with a fragmentation pattern that specified Cys-113 as the site of covalent acyl modification. Comparison of the native (top) and modified peptide (bottom) MS/MS spectra indicates a shift in masses corresponding to a series of b and y ions consistent with a C7 thioester modification at Cys-113. Ions that reveal the 112-Da shift are highlighted in blue and red for native and acylated peptide, respectively.
FIGURE 3.
FIGURE 3.
Relationship between the lipolytic activity and stability of acylated forms of HRASLS enzymes. A, breakdown of 7:0–7:0 PC upon incubation with selected LRAT-like proteins as follows: HRASLS2 (●), HRASLS3 (▿), HRASLS4 (▾), and GST-tLRAT (□). Reaction products were separated and analyzed by LC/MS. The lipid substrate was quantified based on the ratio between the areas under peaks corresponding to intensities of m/z = 482.4 [MH]+ (7:0–7:0 PC) and the internal standard (6:0–6:0 PC, m/z = 454.4 [MH]+) ions. B, differences in stabilities of the acylated forms of HRASLS3 (top) and HRASLS4 (bottom) upon incubation with 7:0–7:0 PC. Mixtures of protein and phospholipid were subjected to LC/MS at different time points after incubation. The chromatograms show base peak intensities. The resolved peaks are labeled as follows: 1a, protein; 1b, acylated form; 2, 7:0–7:0 PC; 3, lyso-PC; arrow, disappearance of acylated form; *, disappearance of 7:0–7:0 PC. The modified form of HRASLS3 persists throughout the 2-h incubation, whereas the HRASLS4 thioester adduct is hydrolyzed within 30 min accompanied by progressive decrease of the substrate. Changes in stability of protein thioester adducts are quantified in C. All experiments were repeated three times in triplicate. Error bars, S.D.
FIGURE 4.
FIGURE 4.
sn-1/sn-2 specificity of HRASLS2–4 lipolytic activity. The preferential site of ester bond hydrolysis in PC was determined by using a phospholipid substrate labeled with NBD chromophore at the sn-2 position (6:0–6:0-NBP PC, structure shown in A, top). A, HRASLS4 (10 μg) incubated with 0.1 mm 6:0–6:0-NBP PC for 15 min under standard conditions used for the lipolysis assay yielded two products with characteristic absorbance for the NBD chromophore (black line) and molecular masses of 533.3 and 294.2 Da, respectively (B). These compounds were identified as 1-hydroxy-2-hexanoyl-NBD-lyso-PC (A, peaks 1a and 1b) and 6-NBD-hexanoic acid (A, peak 2). The structures of both products are shown in A, bottom. Two peaks that correspond to the lyso-PC product indicate a preferential intramolecular acyl shift from the sn-2 to the sn-1 position. Slower phospholipid hydrolytic activity was documented for HRASLS2, and HRASLS3 required a prolonged 3-h incubation to detect any reaction products (A, bottom; data for HRASLS3 shown) leaving most of the substrate intact (peak 3). Control samples, incubated without protein, did not reveal products of 6:0–6:0-NBP PC degradation (A, gray lines). C, absorbance-based quantification of the lipolysis product indicates a lack of strict preference for the cleavage site. Hydrolysis occurred at both the sn-1 and sn-2 positions with a slight preference for the sn-2 position by HRASLS2 and for sn-1 by HRASLS4. HRASLS3 did not show a significant preference toward either site. Error bars, S.D. Experiments were performed in triplicate.
FIGURE 5.
FIGURE 5.
Aminophospholipid acyl chain remodeling activity of HRASLS enzymes. HRASLS proteins were incubated with an equimolar mixture of 7:0–7:0 PC and 6:0–6:0 PE. Reaction mixtures were quenched with methanol and supplement with internal standards, and their lipid composition was determined by LC/MS at various time points. A, in addition to 7:0 lyso-PC and 6:0 lyso-PE, the expected products of substrate hydrolysis, samples containing HRASLS4, evidenced the presence of 6:0 lyso-PC resulting from acyl chain remodeling prior to PC cleavage. Selected chromatographic ion peaks for m/z = 370.4 (7:0 lyso-PC) and m/z = 356.3 (6:0 lyso-PC) are outlined in gray and black, respectively. B, quantification of 6:0 lyso-PC production upon incubation with HRASLS4. 8:0-lyso-PC was used as an internal standard. C, phospholipid acyl chain remodeling in the presence of HRASLS3. Incubation of aminophospholipids with HRASLS3 led to formation of phospholipid products with a mixed acyl composition (6:0–7:0 PC and 7:0–6:0 PE). Chromatograms represent an experiment in which production of mixed acyl phospholipids was enhanced by the presence of HRASLS4 that served as an internal source of 1-hydroxyl-2-heptanoyl-PC. Selected chromatographic ion peaks for m/z = 482.4 (7:0–7:0 PC, substrate) and m/z = 468.4 (6:0–7:0 PC, product) in the top panel and m/z = 412.4 (6:0–6:0 PE, substrate) and m/z = 426.4 (7:0–6:0 PE, product) in the bottom panel are outlined in gray and black, respectively. D, averaged MS spectrum recorded between 11.5 and 13.5 min of elution from the chromatogram shown in C. Indicated [MH]+ ions represent substrates and products of the enzymatic reaction as well as the internal standard (6:0–6:0 PC) used for lipid quantification (m/z = 454.4). E, effect of HRASLS4 on HRASLS2- and HRASLS3-dependent acyl chain remodeling. Enzymatic activity of HRASLS4 or PLA1 from R. oryzae was used to generate 1-hydroxyl-2-heptanoyl-lyso-PC in situ. Open symbols correspond to data points for HRASLS2 collected in the absence of lyso-PC producing enzymes (○) and in the presence of HRASLS4 (Δ) or PLA1 (□). Black colored symbols represent HRASLS3 incubated with HRASLS4 (▾), PLA1 (■). or without any additional protein (●). Error bars, S.D. calculated from two independent experiments, each performed in triplicate.
FIGURE 6.
FIGURE 6.
HRASLS2- and HRASLS3-dependent acyl chain remodeling between PCs. HRASLS proteins were incubated with an equimolar mixture of 7:0–7:0 PC and 6:0–6:0 PC or 7:0–7:0 PC and 16:0–16:0 PC (1:3 molar ratio) for 2 h at 25 °C. Reaction mixtures were quenched with methanol, and the lipid composition was examined by LC/MS (LTQ Velos or LXQ). HRASLS2 (A) and HRASLS3 (B) catalyzed formation of phospholipid products with mixed acyl chain lengths (6:0–7:0 PC). Chromatograms present selected ion signals for m/z = 482.4 (7:0–7:0 PC, substrate) and m/z = 454.4 (6:0–6:0 PC, substrate) and m/z = 468.4 (mixed acylated PC, product). C, averaged MS spectrum recorded between 11.5 and 13.5 min of elution indicates the presence of [MH]+ ions for substrates and the product of this enzymatic reaction. D, MS/MS fragmentation pattern of an ion corresponding to the mixed acylated PC product. Molecular identification of this product was achieved by recording its MS/MS fragmentation in a negative mode with 50% acetonitrile in methanol (v/v) containing 10 mm ammonium formate used as a solvent. The parent ion (m/z = 512.1) represents a typical formate adduct to PC. Its fragmentation (MS2) reveals m/z = 452.1 ions that are characteristic for PC loss of a methyl group (15 Da). Further induced decomposition of this ion (MS3) led to the appearance of two ions m/z = 340.1 and 354.1 that are products of C7 (112 Da) and C6 (98 Da) acyl loss. Similar acyl chain rearrangement occurred in the presence of long acyl chain PC (E and F). Chromatograms represent selected ion signals for m/z = 482.4 (7:0–7:0 PC, substrate) and m/z = 734.7 (16:0–16:0 PC, substrate) and m/z = 608.5 (mixed acylated PC, product). Inset in E represent averaged MS spectrum recorded between 15 and 15.5 min of elution that indicate mass of 7:0–16:0 PC (m/z = 608.5 [M + H]+ and m/z = 630.5 [M + H + Na]+).
FIGURE 7.
FIGURE 7.
Structures of HRASLS2 and HRASLS3. A, ribbon diagram of HRASLS2 with α-helices and β-strands colored in red and blue, respectively. B, structure of HRASLS3 represented as ribbons with secondary structures colored in orange and green. C, structural comparison of HRASLS2 and HRASLS3. The structures were superimposed based on Cα positions in COOT by using the SSM superimpose tool.
FIGURE 8.
FIGURE 8.
Architecture of the HRASLS2 and -3 active sites. A, location of key residues involved in catalysis within the structure of HRASLS3. B, orientation and local interaction of the active site residues. Distances are shown in Å. C, comparison of the active site residues positioned in HRASLS2 (gray) and HRASLS3 (light blue) structures with alternative conformations of His-23 and Cys-113 and its oxidative modification. D, 1.25 Å resolution, σA-weighted 2FoFc electron density map contoured at 1.6σ for HRASLS2 is represented as a gray mesh. The green mesh represents a σA-weighted FoFc omit electron density map contoured at 3.5σ. The appearance of the green mesh electron density next to the Sγ atom of Cys-113 is highly suggestive of an oxidative modification of this residue.
FIGURE 9.
FIGURE 9.
HRASLS3 active site groove and proposed phospholipid membrane topology of HRASLS proteins. A, molecular surface of the protein with its distinctive aminophospholipid-binding groove. Blue and yellow colors correspond to Sγ and Nδ1 atoms of Cys-113, His-23, and His-35. B, charge distribution on the surface of HRASLS3. Negative charges are shown in red and positive charges in blue. The electrostatics calculations were performed with APBS (68). C, HRASLS3 with depicted regions absent in the crystal structure due to genetic manipulation (C-terminal helix) or inadequate electron density (residues 41–57). Secondary structure prediction for the 41–57 fragment of HRASLS3 listed in this panel was performed with the PSIPRED tool available at the University College London, Department of Computer Science server. D, proposed membrane topology for HRASLS3. Missing residues were modeled using MODELLER 9.10 (69) with secondary structure restraints introduced according to theoretical predictions. The color scheme for the molecule surface displays the relative hydrophobicity of the side chains. Blue color corresponds to polar and red indicates hydrophobic residues. E, ribbon representation of the HRASLS3 structure with modeled C-terminal α-helix and 41–57 segment in the phospholipid bilayer. Regions interacting with the membrane hydrophobic core as well as selected residues in the amphipathic α-helix are shown in red.

Similar articles

Cited by

References

    1. van Meer G., Voelker D. R., Feigenson G. W. (2008) Membrane lipids. Where they are and how they behave. Nat. Rev. Mol. Cell Biol. 9, 112–124 - PMC - PubMed
    1. Fernandis A. Z., Wenk M. R. (2007) Membrane lipids as signaling molecules. Curr. Opin. Lipidol. 18, 121–128 - PubMed
    1. Hannun Y. A., Obeid L. M. (2008) Principles of bioactive lipid signaling. Lessons from sphingolipids. Nat. Rev. Mol. Cell Biol. 9, 139–150 - PubMed
    1. Anantharaman V., Aravind L. (2003) Evolutionary history, structural features, and biochemical diversity of the NlpC/P60 superfamily of enzymes. Genome Biol. 4, R11. - PMC - PubMed
    1. Ruiz A., Winston A., Lim Y. H., Gilbert B. A., Rando R. R., Bok D. (1999) Molecular and biochemical characterization of lecithin-retinol acyltransferase. J. Biol. Chem. 274, 3834–3841 - PubMed

Publication types

MeSH terms