Cooperative interactions of BRAFV600E kinase and CDKN2A locus deficiency in pediatric malignant astrocytoma as a basis for rational therapy
- PMID: 22586120
- PMCID: PMC3365162
- DOI: 10.1073/pnas.1117255109
Cooperative interactions of BRAFV600E kinase and CDKN2A locus deficiency in pediatric malignant astrocytoma as a basis for rational therapy
Abstract
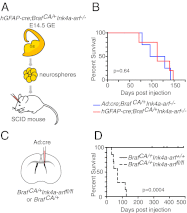
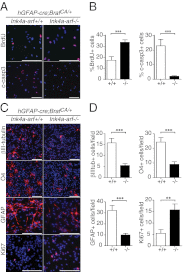
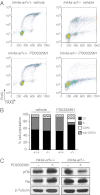
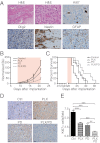
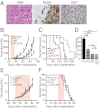
Although malignant astrocytomas are a leading cause of cancer-related death in children, rational therapeutic strategies are lacking. We previously identified activating mutations of v-raf murine sarcoma viral oncogene homolog B1 (BRAF) (BRAF(T1799A) encoding BRAF(V600E)) in association with homozygous cyclin-dependent kinase inhibitor 2A (CDKN2A, encoding p14ARF and p16Ink4a) deletions in pediatric infiltrative astrocytomas. Here we report that BRAF(V600E) expression in neural progenitors (NPs) is insufficient for tumorigenesis and increases NP cellular differentiation as well as apoptosis. In contrast, astrocytomas are readily generated from NPs with additional Ink4a-Arf deletion. The BRAF(V600E) inhibitor PLX4720 significantly increased survival of mice after intracranial transplant of genetically relevant murine or human astrocytoma cells. Moreover, combination therapy using PLX4720 plus the Cyclin-dependent kinase (CDK) 4/6-specific inhibitor PD0332991 further extended survival relative to either monotherapy. Our findings indicate a rational therapeutic strategy for treating a subset of pediatric astrocytomas with BRAF(V600E) mutation and CDKN2A deficiency.
Conflict of interest statement
The authors declare no conflict of interest.
Figures
Similar articles
-
Targeted therapy for BRAFV600E malignant astrocytoma.Clin Cancer Res. 2011 Dec 15;17(24):7595-604. doi: 10.1158/1078-0432.CCR-11-1456. Epub 2011 Oct 28. Clin Cancer Res. 2011. PMID: 22038996 Free PMC article.
-
Paradoxical activation and RAF inhibitor resistance of BRAF protein kinase fusions characterizing pediatric astrocytomas.Proc Natl Acad Sci U S A. 2013 Apr 9;110(15):5957-62. doi: 10.1073/pnas.1219232110. Epub 2013 Mar 26. Proc Natl Acad Sci U S A. 2013. PMID: 23533272 Free PMC article.
-
Clinicopathological characteristics of circumscribed high-grade astrocytomas with an unusual combination of BRAF V600E, ATRX, and CDKN2A/B alternations.Brain Tumor Pathol. 2019 Jul;36(3):103-111. doi: 10.1007/s10014-019-00344-z. Epub 2019 Apr 10. Brain Tumor Pathol. 2019. PMID: 30972500
-
Overcoming acquired BRAF inhibitor resistance in melanoma via targeted inhibition of Hsp90 with ganetespib.Mol Cancer Ther. 2014 Feb;13(2):353-63. doi: 10.1158/1535-7163.MCT-13-0481. Epub 2014 Jan 7. Mol Cancer Ther. 2014. PMID: 24398428
-
Survival advantage combining a BRAF inhibitor and radiation in BRAF V600E-mutant glioma.J Neurooncol. 2016 Feb;126(3):385-93. doi: 10.1007/s11060-015-1939-2. Epub 2015 Sep 18. J Neurooncol. 2016. PMID: 26384810 Free PMC article.
Cited by
-
BRAF Status in Personalizing Treatment Approaches for Pediatric Gliomas.Clin Cancer Res. 2016 Nov 1;22(21):5312-5321. doi: 10.1158/1078-0432.CCR-15-1101. Epub 2016 May 23. Clin Cancer Res. 2016. PMID: 27217440 Free PMC article.
-
Gliomatosis cerebri type 1 with extensive involvement of the spinal cord and BRAF V600E mutation.Pathol Oncol Res. 2014 Jan;20(1):215-20. doi: 10.1007/s12253-013-9732-z. Epub 2013 Dec 19. Pathol Oncol Res. 2014. PMID: 24353007
-
Targeting Wee1 for the treatment of pediatric high-grade gliomas.Neuro Oncol. 2014 Mar;16(3):352-60. doi: 10.1093/neuonc/not220. Epub 2013 Dec 4. Neuro Oncol. 2014. PMID: 24305702 Free PMC article.
-
Detection of a Distinctive Genomic Signature in Rhabdoid Glioblastoma, A Rare Disease Entity Identified by Whole Exome Sequencing and Whole Transcriptome Sequencing.Transl Oncol. 2015 Aug;8(4):279-87. doi: 10.1016/j.tranon.2015.05.003. Transl Oncol. 2015. PMID: 26310374 Free PMC article.
-
New strategies in pediatric gliomas: molecular advances in pediatric low-grade gliomas as a model.Clin Cancer Res. 2013 Sep 1;19(17):4553-8. doi: 10.1158/1078-0432.CCR-13-0662. Epub 2013 Jul 23. Clin Cancer Res. 2013. PMID: 23881924 Free PMC article.
References
-
- Central Brain Tumor Registry of the United States (2004–2007) Primary Brain and Central Nervous System Tumors Diagnosed in the United States in 2004–2007, Statistical Report. Available at http://www.cbtrus.org/reports/reports.html. Accessed September 11, 2011.
-
- Phillips HS, et al. Molecular subclasses of high-grade glioma predict prognosis, delineate a pattern of disease progression, and resemble stages in neurogenesis. Cancer Cell. 2006;9:157–173. - PubMed
Publication types
MeSH terms
Substances
Grants and funding
- R01 NS040511/NS/NINDS NIH HHS/United States
- R01 CA131261/CA/NCI NIH HHS/United States
- R01 NS080619/NS/NINDS NIH HHS/United States
- R01 NS057727/NS/NINDS NIH HHS/United States
- HHMI/Howard Hughes Medical Institute/United States
- R01 CA159467/CA/NCI NIH HHS/United States
- R01 CA164746/CA/NCI NIH HHS/United States
- R01CA131261/CA/NCI NIH HHS/United States
- P50 CA097257/CA/NCI NIH HHS/United States
- R01CA159467/CA/NCI NIH HHS/United States
- K08 NS063456/NS/NINDS NIH HHS/United States
- P30 CA016672/CA/NCI NIH HHS/United States
- 1R01CA164746/CA/NCI NIH HHS/United States
- K08 NS065268/NS/NINDS NIH HHS/United States
- 5K08NS063456/NS/NINDS NIH HHS/United States
- K08NS065268/NS/NINDS NIH HHS/United States
- 2R01NS057727-05/NS/NINDS NIH HHS/United States
- CA097257/CA/NCI NIH HHS/United States
LinkOut - more resources
Full Text Sources
Other Literature Sources
Molecular Biology Databases
Research Materials
Miscellaneous

