. 2012 Feb;2(2):172-189.
doi: 10.1158/2159-8290.CD-11-0224. Epub 2011 Dec 29.

Essential gene profiles in breast, pancreatic, and ovarian cancer cells

Affiliations

Essential gene profiles in breast, pancreatic, and ovarian cancer cells

Richard Marcotte et al. Cancer Discov. 2012 Feb.

Abstract

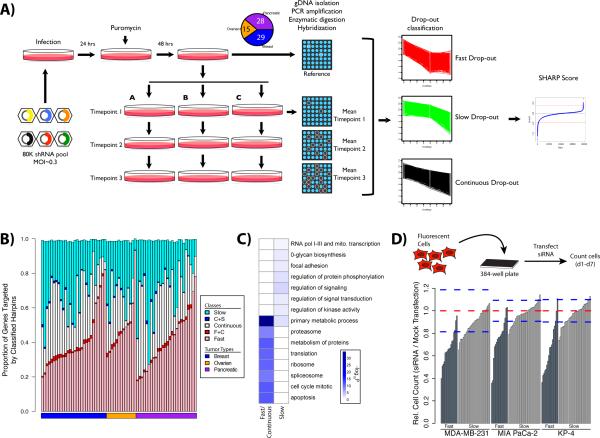
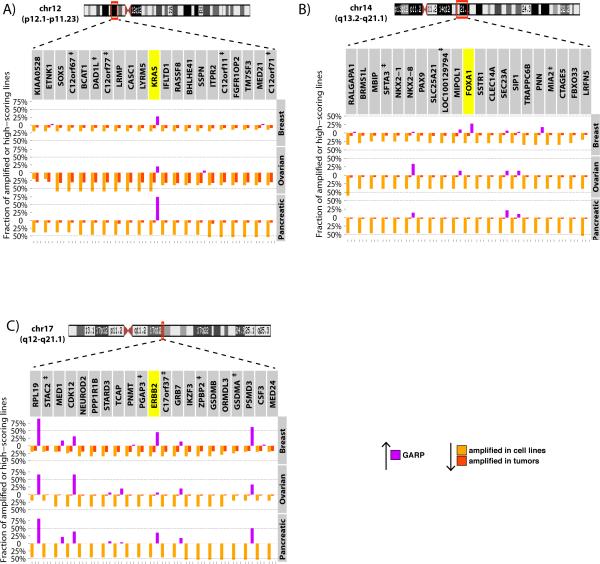
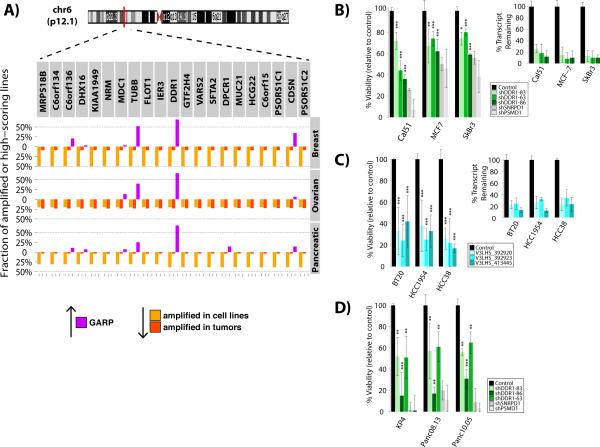
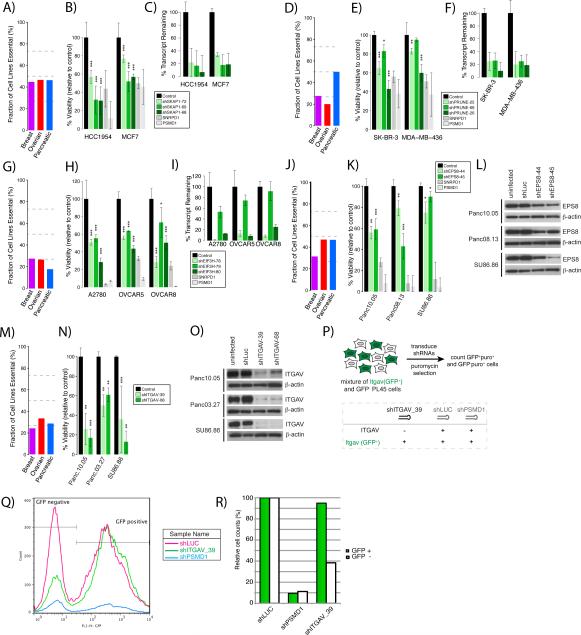
Genomic analyses are yielding a host of new information on the multiple genetic abnormalities associated with specific types of cancer. A comprehensive description of cancer-associated genetic abnormalities can improve our ability to classify tumors into clinically relevant subgroups and, on occasion, identify mutant genes that drive the cancer phenotype ("drivers"). More often, though, the functional significance of cancer-associated mutations is difficult to discern. Genome-wide pooled short hairpin RNA (shRNA) screens enable global identification of the genes essential for cancer cell survival and proliferation, providing a "functional genomic" map of human cancer to complement genomic studies. Using a lentiviral shRNA library targeting ~16,000 genes and a newly developed, dynamic scoring approach, we identified essential gene profiles in 72 breast, pancreatic, and ovarian cancer cell lines. Integrating our results with current and future genomic data should facilitate the systematic identification of drivers, unanticipated synthetic lethal relationships, and functional vulnerabilities of these tumor types.

Significance: This study presents a resource of genome-scale, pooled shRNA screens for 72 breast, pancreatic, and ovarian cancer cell lines that will serve as a functional complement to genomics data, facilitate construction of essential gene profiles, help uncover synthetic lethal relationships, and identify uncharacterized genetic vulnerabilities in these tumor types.

Significance: This study presents a resource of genome-scale, pooled shRNA screens for 72 breast, pancreatic, and ovarian cancer cell lines that will serve as a functional complement to genomics data, facilitate construction of essential gene profiles, help uncover synthetic lethal relationships, and identify uncharacterized genetic vulnerabilities in these tumor types.


Figures

Figure 1
Figure 1
Outline of Procedure for Timecourse shRNA Screening. (A) Schematic representing the steps that are involved in the shRNA functional screening. (B) Hairpins were classified based on heuristic rules (see Supplemental Table 3). The proportion of genes falling into each category is shown as a stacked bar chart. The pink, white and cyan bar segments detail genes that are targeted by a single hairpin class, while the red and blue segments indicate the sparse overlap between classes. Stacked bars do not reach a value of 1.0 as the minimal overlap observed between fast and slow, as well as all three classes is omitted. The full classification results are shown in Supplemental Table 3. (C) Enrichment plot of GO ‘Biological Process’ terms and MSigDB pathways within classified hairpins. Darker blue colours indicate more significant p-values corresponding to the enrichment. The full set of enriched terms is shown in Supplemental Figure 1. (D) Validation of selected shRNA hits by siRNA. Growth inhibition due to target gene knock-down was determined relative to mock transfected controls in MDA-MB-231, MIA PaCa-2, and KP4 cell lines. Red dashed lines indicate the mean of 60 replicate mock transfections, while the blue dashed lines indicate mean ± 3 standard deviations.
Figure 2
Figure 2
Comparison of shRNA Scoring Approaches. (A) Overlap of genes ranked by GARP, RIGER (‘Kolmogorov-Smirnov’, ‘Second-best hairpin’, and ‘Weighted Sum’), and RSA with two datasets enriched in essential genes: ‘housekeeping genes’ defined by gene expression (see Methods), and human genes conserved in eight eukaryotic species. Representative results for the breast cancer line HCC1187 (left panels), ovarian cancer cell line OVCAR5 (centre panels), and pancreatic cell line HPAF-II (right panels) are shown. Overlaps are included for ten samples of randomly selected genes (black lines, mean ± sd). (B) Cumulative distribution plots of the area under the curve (AUC) for each overlap. At each threshold on the x-axis, the fraction of cell lines with higher AUCs is indicated for each scoring method. (Upper panel) Overlap with highly conserved orthologs. (Lower panel) Overlap with housekeeping genes. (C) Stacked bar chart shows the proportion of genes from the overlap of the top 500 GARP-scored genes and the reference sets (HK and orthologs) that are unique to the HK set, unique to the ortholog set, or common to both. (D) Venn diagrams of the top 500 ranked genes for each scoring method in cell lines HCC1187, OVCAR5, and HPAF-II. (E) GARP shows the lowest rate of targeting non-expressed transcripts. “Non-expression rates” (NERs) were determined by RNA-seq for genes ranked by GARP, RSA and RIGER in seven ovarian shRNA screens. The proportion of non-expressed genes with RPKM = 0 was calculated for the top N ranked genes within each cell line, and the results were averaged for each scoring metric (see Methods).
Figure 3
Figure 3
Identification of general and tissue-specific essential genes. (A) Representation of the selection criteria underlying the definition of the 285 general essential genes. Histogram at right shows the number of cell lines in which each gene is found essential. The ‘Wordle’ (inset) depicts the most frequently occurring KEGG pathways among the general essential genes, where the most frequently occurring terms are illustrated in larger font. (B) Heatmap of differentially essential genes in the three tumor types. 151 genes were identified as specific to breast cell lines, 72 to ovarian cell lines, and 175 to pancreatic cell lines. The complete list of genes is available in Supplemental Table 8. (C) The range of zGARP scores for six tissue-specific genes. P-values comparing the range of scores were determined using the Kruskal-Wallis test.
Figure 4
Figure 4
Subtype classification of breast functional screening results. (A) Unsupervised hierarchical clustering of functional screening data classifies the breast cancer cell lines into the known breast cancer subtypes. Seventeen genes correspond to the Luminal/HER2+ subtypes, while 24 were specific to the Basal subtype. (B) Supervised clustering of the screening results according to known breast cancer subtypes. (C) Normalized zGARP scores for genes displaying differential essentiality in specific breast subtypes. Only MYO3B and ESR1 had signals strong enough to be included in the unsupervised analysis at the FDR threshold used. p-values comparing the range of scores were determined using the Kruskal-Wallis test. (D) The normalized gene expression level of four genes identified as luminal/HER2+ specific (FOXA1, SPDEF) or basal subtype-specific (CENPO, NLN) was obtained from the TCGA data portal. The expression data included 42 basal subtype, 63 HER2+ subtype, and 223 luminal subtype tumor samples. p-values comparing the range of expression values were determined using the Kruskal-Wallis test.
Figure 5
Figure 5
Pattern of functional screening data in amplifications with known drivers. Chromosome ideograms indicate known regions of amplification in tumors. Barplots above the X-axis depict frequency of cell lines in which each indicated gene is essential according to GARP scores (p<0.05), while below the X-axis depict the frequency of observed amplifications in cell lines (orange) or tumors (red). For each plot, the ten genes upstream and downstream of the suspected oncogenic driver gene (yellow) are shown.
Figure 6
Figure 6
Confirmation of the essential role of DDR1 in breast and pancreatic cell lines. (A) As described in Figure 4, but for DDR1. (B) Relative number of cells remaining six days post-infection with three different DDR1 shRNAs. SNRPD1 and PSMD1 shRNA were used as positive controls, as these were the two most potent shRNA in pooled screening. Control shRNA is the average of a GFP, a LacZ, and a Luciferase shRNA. DDR1 shRNA viability/cell number is depicted relative to control. Experiments were performed in triplicate. p-value was derived using a one-tailed Student's T-test. (shDDR1-83: TRCN0000121083, shDDR1-86: TRCN0000121086, shDDR1-63: TRCN0000121163). Small graph insert, Percentage transcript remaining determined by qPCR relative to GFP shRNA control. (C) Relative number of cells remaining nine days post-infection with three different pGIPZ DDR1 shRNAs. Negative control was a non-silencing shRNA. Small graph insert, Percentage transcript remaining determined by qPCR relative to GFP shRNA control. (D) Relative cell number determined as in (B), in pancreatic cell lines. *p<0.05, **p<0.01, ***p<0.001
Figure 7
Figure 7
Validation of genes that are overexpressed or in regions of copy number gains in cancer cells. (A) Percentage of cell lines in which SKAP1 was in the top 5% of essential genes according to GARP. (B) Relative number of breast cancer cells remaining six days post-infection with three different SKAP1 shRNAs. SNRPD1 and PSMD1 shRNA were included as positive controls. Control shRNA is the average of a GFP, a LacZ, and a Luciferase shRNA. Viability/cell number is depicted relative to control. p-value was derived using a one-tailed Student's T-test from triplicate experiments. (C) Percentage transcript remaining determined by qPCR relative to GFP shRNA control. (D-F) Same as (A-C) for PRUNE. (G-I) Same as (A-C) for EIF3H in ovarian cell lines. (J-K) Same as (A-B) for EPS8 in pancreatic cell lines. (L) Western blot of EPS8 knockdown in pancreatic cell lines. (M-N) Same as (A-B) for ITGAV in pancreatic cell lines. (O) Western blot showing effects of ITGAV knockdown in pancreatic cell lines. (P) Experimental scheme for ITGAV rescue experiment. (Q) Flow cytometry results for ITGAV rescue experiment. (R) Quantification of results in Q. *p<0.05, **p<0.01, ***p<0.001.

Similar articles

Cited by

References

    1. Chin K, DeVries S, Fridlyand J, Spellman PT, Roydasgupta R, Kuo WL, et al. Genomic and transcriptional aberrations linked to breast cancer pathophysiologies. Cancer Cell. 2006;10:529–41. - PubMed
    1. Sorlie T, Perou CM, Tibshirani R, Aas T, Geisler S, Johnsen H, et al. Gene expression patterns of breast carcinomas distinguish tumor subclasses with clinical implications. Proceedings of the National Academy of Sciences of the United States of America. 2001;98:10869–74. - PMC - PubMed
    1. Campbell PJ, Yachida S, Mudie LJ, Stephens PJ, Pleasance ED, Stebbings LA, et al. The patterns and dynamics of genomic instability in metastatic pancreatic cancer. Nature. 2010;467:1109–13. - PMC - PubMed
    1. Stephens PJ, McBride DJ, Lin ML, Varela I, Pleasance ED, Simpson JT, et al. Complex landscapes of somatic rearrangement in human breast cancer genomes. Nature. 2009;462:1005–10. - PMC - PubMed
    1. Pleasance ED, Stephens PJ, O'Meara S, McBride DJ, Meynert A, Jones D, et al. A small-cell lung cancer genome with complex signatures of tobacco exposure. Nature. 2010;463:184–90. - PMC - PubMed

Publication types

Substances