. 2012 Jun 29;46(6):847-58.
doi: 10.1016/j.molcel.2012.04.004. Epub 2012 May 10.

Translational homeostasis via the mRNA cap-binding protein, eIF4E

Affiliations

Translational homeostasis via the mRNA cap-binding protein, eIF4E

Akiko Yanagiya et al. Mol Cell. .

Abstract

Translational control of gene expression plays a key role in many biological processes. Consequently, the activity of the translation apparatus is under tight homeostatic control. eIF4E, the mRNA 5' cap-binding protein, facilitates cap-dependent translation and is a major target for translational control. eIF4E activity is controlled by a family of repressor proteins, termed 4E-binding proteins (4E-BPs). Here, we describe the surprising finding that despite the importance of eIF4E for translation, a drastic knockdown of eIF4E caused only minor reduction in translation. This conundrum can be explained by the finding that 4E-BP1 is degraded in eIF4E-knockdown cells. Hypophosphorylated 4E-BP1, which binds to eIF4E, is degraded, whereas hyperphosphorylated 4E-BP1 is refractory to degradation. We identified the KLHL25-CUL3 complex as the E3 ubiquitin ligase, which targets hypophosphorylated 4E-BP1. Thus, the activity of eIF4E is under homeostatic control via the regulation of the levels of its repressor protein 4E-BP1 through ubiquitination.


Figures

Figure 1
Figure 1
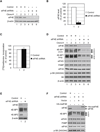
Translational Homeostasis in eIF4E-KD Cells Occurs Concomitantly with the Disappearance of the Hypophosphorylated 4E-BP1. (A) Control HeLa S3 cells expressing a scrambled shRNA sequence of eIF4E and cells expressing shRNA targeting eIF4E (eIF4E-KD) were generated. eIF4E and β -actin levels were determined by western blotting. (B) Quantification of KD levels of eIF4E from (A). eIF4E band intensities were measured using NIH ImageJ and normalized against β-actin. The value in control was set as 100%, and data are mean ± SD. (C) Effect of eIF4E KD on protein synthesis. Cells were incubated with [35S]methionine (10 µCi/ml) for 30 min. Radioactivity incorporated into 5% trichloroacetic acid-precipitated material was measured in a scintillation counter. The value in control was set as 100%, and data are mean ± SD of three separate experiments. (D) Protein levels of translation factors in eIF4E-KD as compared to control cells. Protein levels of the indicated proteins were analyzed along with phosphorylated rpS6 by western blotting. Short and long refer to exposure time against an X-ray film. (E) 4E-BP2 level is decreased in eIF4E-KD cells. 4E-BP2 was analyzed in control and eIF4E-KD cells as described above with an antibody specific for 4E-BP2. (F) Levels of the hypophosphorylated 4E-BP1 were maintained by expression of HA-tagged mouse eIF4E (meIF4E). A stable eIF4E-KD cell expressing HA-tagged meIF4E was generated, and protein levels of translation factors were analyzed by western blotting. See also Table S1.
Figure 1
Figure 1
Translational Homeostasis in eIF4E-KD Cells Occurs Concomitantly with the Disappearance of the Hypophosphorylated 4E-BP1. (A) Control HeLa S3 cells expressing a scrambled shRNA sequence of eIF4E and cells expressing shRNA targeting eIF4E (eIF4E-KD) were generated. eIF4E and β -actin levels were determined by western blotting. (B) Quantification of KD levels of eIF4E from (A). eIF4E band intensities were measured using NIH ImageJ and normalized against β-actin. The value in control was set as 100%, and data are mean ± SD. (C) Effect of eIF4E KD on protein synthesis. Cells were incubated with [35S]methionine (10 µCi/ml) for 30 min. Radioactivity incorporated into 5% trichloroacetic acid-precipitated material was measured in a scintillation counter. The value in control was set as 100%, and data are mean ± SD of three separate experiments. (D) Protein levels of translation factors in eIF4E-KD as compared to control cells. Protein levels of the indicated proteins were analyzed along with phosphorylated rpS6 by western blotting. Short and long refer to exposure time against an X-ray film. (E) 4E-BP2 level is decreased in eIF4E-KD cells. 4E-BP2 was analyzed in control and eIF4E-KD cells as described above with an antibody specific for 4E-BP2. (F) Levels of the hypophosphorylated 4E-BP1 were maintained by expression of HA-tagged mouse eIF4E (meIF4E). A stable eIF4E-KD cell expressing HA-tagged meIF4E was generated, and protein levels of translation factors were analyzed by western blotting. See also Table S1.
Figure 2
Figure 2
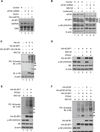
Hypophosphorylated 4E-BP1 Is Degraded by the Ubiquitin-Proteasome Pathway. (A) 4E-BP1 mRNA levels in control and eIF4E-KD cells are shown. Total RNA was extracted from control, eIF4E-KD, and eIF4E-KD expressing the empty vector or HA-tagged meIF4E. 4E-BP1 mRNA levels were analyzed by northern blotting. GAPDH mRNA, 18S and 28S ribosomal RNAs detected by ethidium bromide (EtBr) staining served as loading controls. (B) Degradation of the hypophosphorylated 4E-BP1 is blocked by MG132 and Lactacystin. Control and eIF4E-KD cells were treated with DMSO, MG132 (20 µM), or Lactacystin (20 µM) for 3 hr. eIF4E, 4E-BP1 levels, and phosphorylated rpS6 were determined by western blotting. (C) eIF4E-unbound hypophosphorylated 4E-BP1 is highly ubiquitinated. 4E-BP1 and the eIF4E-unbound hypophosphorylated 4E-BP1 mimic mutant (4E-BP1-4A-LM-AA) were expressed in HEK293 cells together with His-Ub, and cells were treated with 20 µM MG132 for 6 hr. His-Ub proteins were pulled down with Ni-NTA agarose and analyzed by western blotting. Expression of exogenous proteins and β-actin in the lysates is shown in the panels below. Arrows and a bar indicate mono-ubiquitinated and polyubiquitinated 4E-BP1. An arrowhead indicates a nonspecific band. PD, pull-down; IB, immunoblot. (D) Hypophosphorylated 4E-BP1 levels are restored by MG132 treatment in cells treated with PP242. HA-4E-BP1 was transiently expressed in eIF4E-KD HEK293 cells, which were treated with 2.5 µM PP242 for 24 hr. Cells were cultured for the last 3 hr in the absence or presence of 20 µM MG132. 4E-BP1, rpS6, and β-actin levels were analyzed by western blotting. (E) Hypophosphorylated 4E-BP1 in PP242-treated cells is more ubiquitinated than in PP242-untreated cells. HA-4E-BP1 was expressed in 4E-BP DKO MEFs along with His-Ub, and cells were cultured in the absence or presence of PP242 for 24 hr, followed by in vitro ubiquitination assay. Pull-downed proteins were analyzed by western blotting. HA-4E-BP1, phosphorylated rpS6, and β-actin levels in cell lysates are shown below. Arrows and a bar indicate mono-ubiquitinated and polyubiquitinated 4E-BP1. (F) The interaction between 4E-BP1 and eIF4E prevents the hypophosphorylated 4E-BP1 from becoming ubiquitinated. HA-4E-BP1, HA-eIF4E, and HA-eIF4EW73A were expressed in 4E-BP DKO MEFs along with His-Ub, and an in vitro ubiquitination assay was performed as described in (C). See also Figure S1 and Table S2.
Figure 2
Figure 2
Hypophosphorylated 4E-BP1 Is Degraded by the Ubiquitin-Proteasome Pathway. (A) 4E-BP1 mRNA levels in control and eIF4E-KD cells are shown. Total RNA was extracted from control, eIF4E-KD, and eIF4E-KD expressing the empty vector or HA-tagged meIF4E. 4E-BP1 mRNA levels were analyzed by northern blotting. GAPDH mRNA, 18S and 28S ribosomal RNAs detected by ethidium bromide (EtBr) staining served as loading controls. (B) Degradation of the hypophosphorylated 4E-BP1 is blocked by MG132 and Lactacystin. Control and eIF4E-KD cells were treated with DMSO, MG132 (20 µM), or Lactacystin (20 µM) for 3 hr. eIF4E, 4E-BP1 levels, and phosphorylated rpS6 were determined by western blotting. (C) eIF4E-unbound hypophosphorylated 4E-BP1 is highly ubiquitinated. 4E-BP1 and the eIF4E-unbound hypophosphorylated 4E-BP1 mimic mutant (4E-BP1-4A-LM-AA) were expressed in HEK293 cells together with His-Ub, and cells were treated with 20 µM MG132 for 6 hr. His-Ub proteins were pulled down with Ni-NTA agarose and analyzed by western blotting. Expression of exogenous proteins and β-actin in the lysates is shown in the panels below. Arrows and a bar indicate mono-ubiquitinated and polyubiquitinated 4E-BP1. An arrowhead indicates a nonspecific band. PD, pull-down; IB, immunoblot. (D) Hypophosphorylated 4E-BP1 levels are restored by MG132 treatment in cells treated with PP242. HA-4E-BP1 was transiently expressed in eIF4E-KD HEK293 cells, which were treated with 2.5 µM PP242 for 24 hr. Cells were cultured for the last 3 hr in the absence or presence of 20 µM MG132. 4E-BP1, rpS6, and β-actin levels were analyzed by western blotting. (E) Hypophosphorylated 4E-BP1 in PP242-treated cells is more ubiquitinated than in PP242-untreated cells. HA-4E-BP1 was expressed in 4E-BP DKO MEFs along with His-Ub, and cells were cultured in the absence or presence of PP242 for 24 hr, followed by in vitro ubiquitination assay. Pull-downed proteins were analyzed by western blotting. HA-4E-BP1, phosphorylated rpS6, and β-actin levels in cell lysates are shown below. Arrows and a bar indicate mono-ubiquitinated and polyubiquitinated 4E-BP1. (F) The interaction between 4E-BP1 and eIF4E prevents the hypophosphorylated 4E-BP1 from becoming ubiquitinated. HA-4E-BP1, HA-eIF4E, and HA-eIF4EW73A were expressed in 4E-BP DKO MEFs along with His-Ub, and an in vitro ubiquitination assay was performed as described in (C). See also Figure S1 and Table S2.
Figure 3
Figure 3
Half-Life of the Hypophosphorylated 4E-BP1 Is Reduced in eIF4E-KD Cells. (A) Half-life of the hypophosphorylated 4E-BP1 is shown. Control and eIF4E-KD cells were treated with 2.5 µM PP242 for 24 hr and then treated with cycloheximide (CHX) (100 µg/ml) for the indicated times. 4E-BP1 and β-actin levels were analyzed by western blotting. (B) Quantitative analysis of the hypophosphorylated 4E-BP1 amounts in (A). The intensities of the bands were measured using NIH ImageJ and normalized against β-actin. The intensity of the band at 0 hr (lane 1) is set as 100%. The half-life of the hypophosphorylated 4E-BP1 in control (2.0 hr) and in eIF4E-KD cells (0.6 hr) is indicated. (C) Half-life of the nonphosphorylatable 4E-BP1 mutant, 4E-BP1-4A, is shortened in the absence of eIF4E. Control and eIF4E-KD cells expressing 4E-BP1-4A were generated. Cells were treated with CHX (100 µg/ml) and harvested at the indicated times. 4E-BP1-4A and β-actin levels were determined by western blotting. (D) Quantitative analysis of 4E-BP1-4A in (C). The intensities of the bands were normalized against β-actin. The intensity of the band at 0 hr is set as 100%. The half-life of 4E-BP1-4A in control (1.5 hr) and eIF4E-KD cells (0.7 hr) is indicated. The data shown in (A) and (C) are representative of three experiments. Quantitative data with mean ± SD are shown in (B) and (D). *p < 0.05 using an unpaired Student’s t test.
Figure 4
Figure 4
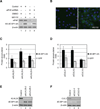
KLHL25-CUL3 Ubiquitin Ligase Targets the Hypophosphorylated Form of 4E-BP1 for Degradation. (A) Generation of stable cell lines expressing 4E-BP1-4A using control or eIF4E-KD cells is shown. Cells were treated with DMSO or 5 µM MG132 for 3 hr. eIF4E, 4EBP1-4A, and β-actin levels were analyzed by western blotting. (B) 4E-BP1-4A was stabilized in eIF4E-KD cells by MG132 treatment. eIF4E-KD cells expressing 4E-BP1-4A were treated with either DMSO (left panel) or 5 mM MG132 (right panel) for 3 hr. Accumulation of 4E-BP1-4A was analyzed by immunofluorescence. Cells were fixed, and HA-4E-BP1-4A was determined with anti-HA antibody and Alexa Fluor 488 anti-rabbit IgG (green). Nuclei were stained with DAPI (blue). (C and D) eIF4E-KD cells expressing either 4E-BP1-4A or GFP were transfected with siRNAs targeting KLHL25 (C) or CUL3 (D). Accumulation of 4E-BP1-4A (black bars) and GFP (gray bars) was determined by microscopy. Each sample was normalized against samples treated with the nonspecific siRNAs. Data are mean ± SD of two separate experiments. (E and F) 4E-BP1-4A levels are restored by siRNAs targeting KLHL25 (E) and CUL3 (F). To confirm the results obtained by the high-content screening, the KD efficiencies of both KLHL25 (E) and CUL3 (F) and 4E-BP1-4A levels were determined by western blotting. See also Figure S2 and Tables S3 and S4.
Figure 5
Figure 5
KLHL25-CUL3 Complex Decreases the Stability of the Hypophosphorylated 4E-BP1. (A) A schematic diagram of KLHL25 is shown. The BTB domain, Back domain, and six repeats of the kelch motif are shown. The numbers above indicate amino acids. (B) KLHL25 interacts with 4E-BP1-4A and CUL3. HA-4EBP1-4A, MYC-KLHL25, FLAG-CUL3, or FLAG-CUL7 was expressed in HEK293 cells. Two days after transfection, cells were treated with 20 µM MG132 for 3 hr. Cell lysates (2 mg) were incubated with either anti-HA antibody (upper panel) or anti-MYC antibody (second panel from top). Immunoprecipitated proteins were analyzed by western blotting. Input proteins for immunoprecipitation (IP) are shown in the panels below. An arrowhead indicates immunoprecipitated protein by anti-HA antibody, and an arrow indicates immunoprecipitated protein by anti-MYC antibody. IB, immunoblot. (C) The hypophosphorylated 4E-BP1 in PP242-treated cells strongly interacts with KLHL25. HA-4E-BP1 and HA-4E-BP1-LM-AA were expressed together with MYCKLHL25 in HEK293 cells, which were cultured in the absence or presence of 2.5 mMPP242 for 24 hr. Cells were treated with 20 µM MG132 for 3 hr before sample collection. Cell lysate (4 mg) was incubated with anti-HA antibody, and immunoprecipitated proteins were analyzed by western blotting. Expression of HA-4E-BP1, HA-4E-BP1-LM-AA, MYC-KLHL25, β-actin, and the phosphorylation of rpS6 in cell lysates are shown below. An arrow indicates KLHL25 that interacts with the hypophosphorylated 4E-BP1. (D) KLHL25 and CUL3 promote ubiquitination of the hypophosphorylated 4E-BP1. HA-4E-BP1-4A, MYCKLHL25, and FLAG-CUL3 were expressed along with His-Ub, and an in vitro ubiquitination assay was performed as described above. Arrows and a bar indicate monoubiquitinated and polyubiquitinated HA-4E-BP1-4A. An arrowhead indicates a nonspecific band. Input HA-4EBP1-4A, MYC-KLHL25, FLAG-CUL3, and β-actin are shown in the panels below.
Figure 6
Figure 6
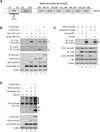
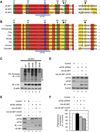
Lys57 Is the Most Probable Ubiquitination Site of 4E-BP1. (A) Amino acid sequence alignment of human 4E-BPs is shown. Four phosphorylation sites (Thr37, Thr46, Ser65, and Thr70) are marked in green, and the putative ubiquitination site (Lys57) is marked in blue. A blue bar indicates the eIF4E-binding site. Numbers above indicate amino acids. (B) Phylogenetic amino acid sequence alignment of 4E-BP1. (C) Lys57 is the likely ubiquitination site of 4E-BP1. HAtagged 4E-BP1, 4E-BP1-K57R, 4E-BP1-K69R, 4E-BP1-K105R, or 4E-BP1-3K3R was expressed in 4E-BP DKO MEFs along with His-Ub. An in vitro ubiquitination assay was performed as described before. Expression levels of HA-4E-BP1s and β-actin in cell lysates are shown below. An arrow and a bar indicate mono-ubiquitinated and polyubiquitinated 4E-BP1, respectively. (D) HA-4E-BP1 or HA-4E-BP1-K57R was transiently expressed in eIF4E-KD cells. eIF4G, eIF4E, HA-4E-BP1s, and b-actin levels were determined by western blotting. (E) eIF4F complex formation in cells expressing the nonubiquitinatable 4E-BP1. Cell lysates were subjected to m7GDP pull-down. One millimolar m7GDP was added as a competitor (lane 2). m7GDP-associated proteins were assessed by western blotting. (F) The effect of the nonubiquitinatable 4E-BP1 on protein synthesis is shown. Control (white), eIF4E-KD (black), eIF4E-KD cells expressing HA-4E-BP1 (gray) or HA-4EBP1-K57R (hatched) were subjected to [35S]methionine metabolic labeling. The value in control was set as 100%, and data are mean ± SD of three separate experiments. IB, immunoblot; PD, pull-down. See also Figure S3.
Figure 7
Figure 7
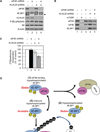
KLHL25 Silencing in eIF4E-KD Cells Inhibits Protein Synthesis, and the Molecular Mechanism of 4E-BP1 Stability. (A) Establishment of KLHL25-KD cells is shown. Control and eIF4E-KD cells were infected with lentivirus expressing control shRNA or shRNA against KLHL25. eIF4E, 4E-BP1, KLHL25, β-actin, and phosphorylated rpS6 were analyzed by western blotting. An arrow indicates the hypophosphorylated 4E-BP1. (B) eIF4F complex formation in control, eIF4E-KD, KLHL25-KD, and eIF4E-KLHL25-DKD cells. Cell lysates were subjected to m7GDP pull-down. One millimolar m7GDP was added as a competitor (lane 2). m7GDP-associated proteins were assessed by western blotting. (C) Total protein synthesis in KLHL25-KD cells is shown. Protein synthesis in control (white), eIF4E-KD (black), KLHL25-KD (gray), and eIF4E-KLHL25-DKD cells (hatched) was investigated by metabolic radiolabeling using [35S]methionine. Protein synthesis is shown as a percentage of the value in control cells. The average of the three different experiments with SD is shown. (D) Model of the molecular mechanism of 4E-BP1 stability is illustrated. eIF4E-bound hypophosphorylated 4E-BP1 (1) and the hyperphosphorylated 4E-BP1 (2) are stable. eIF4E-unbound hypophosphorylated 4E-BP1 (3) is unstable. It is degraded after ubiquitination by the KLHL25-CUL3 E3 ubiquitin ligase. See also Figure S4.
Figure 7
Figure 7
KLHL25 Silencing in eIF4E-KD Cells Inhibits Protein Synthesis, and the Molecular Mechanism of 4E-BP1 Stability. (A) Establishment of KLHL25-KD cells is shown. Control and eIF4E-KD cells were infected with lentivirus expressing control shRNA or shRNA against KLHL25. eIF4E, 4E-BP1, KLHL25, β-actin, and phosphorylated rpS6 were analyzed by western blotting. An arrow indicates the hypophosphorylated 4E-BP1. (B) eIF4F complex formation in control, eIF4E-KD, KLHL25-KD, and eIF4E-KLHL25-DKD cells. Cell lysates were subjected to m7GDP pull-down. One millimolar m7GDP was added as a competitor (lane 2). m7GDP-associated proteins were assessed by western blotting. (C) Total protein synthesis in KLHL25-KD cells is shown. Protein synthesis in control (white), eIF4E-KD (black), KLHL25-KD (gray), and eIF4E-KLHL25-DKD cells (hatched) was investigated by metabolic radiolabeling using [35S]methionine. Protein synthesis is shown as a percentage of the value in control cells. The average of the three different experiments with SD is shown. (D) Model of the molecular mechanism of 4E-BP1 stability is illustrated. eIF4E-bound hypophosphorylated 4E-BP1 (1) and the hyperphosphorylated 4E-BP1 (2) are stable. eIF4E-unbound hypophosphorylated 4E-BP1 (3) is unstable. It is degraded after ubiquitination by the KLHL25-CUL3 E3 ubiquitin ligase. See also Figure S4.

Comment in

Similar articles

Cited by

References

    1. Braunstein S, Karpisheva K, Pola C, Goldberg J, Hochman T, Yee H, Cangiarella J, Arju R, Formenti SC, Schneider RJ. A hypoxia-controlled cap-dependent to cap-independent translation switch in breast cancer. Mol. Cell. 2007;28:501–512. - PubMed
    1. Cormier P, Pyronnet S, Morales J, Mulner-Lorillon O, Sonenberg N, Belle R. eIF4E association with 4E-BP decreases rapidly following fertilization in sea urchin. Dev. Biol. 2001;232:275–283. - PubMed
    1. Dowling RJ, Topisirovic I, Alain T, Bidinosti M, Fonseca BD, Petroulakis E, Wang X, Larsson O, Selvaraj A, Liu Y, et al. mTORC1-mediated cell proliferation, but not cell growth, controlled by the 4E-BPs. Science. 2010;328:1172–1176. - PMC - PubMed
    1. Duncan R, Milburn SC, Hershey JW. Regulated phosphorylation and low abundance of HeLa cell initiation factor eIF-4F suggest a role in translational control. Heat shock effects on eIF-4F. J. Biol. Chem. 1987;262:380–388. - PubMed
    1. Elia A, Constantinou C, Clemens MJ. Effects of protein phosphorylation on ubiquitination and stability of the translational inhibitor protein 4E-BP1. Oncogene. 2008;27:811–822. - PubMed

Publication types

MeSH terms

LinkOut - more resources