Cross-regulation between FOXA1 and ErbB2 signaling in estrogen receptor-negative breast cancer
- PMID: 22577344
- PMCID: PMC3349255
- DOI: 10.1593/neo.12294
Cross-regulation between FOXA1 and ErbB2 signaling in estrogen receptor-negative breast cancer
Abstract
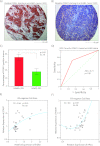
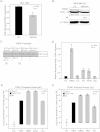
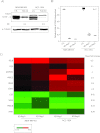
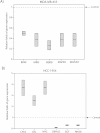
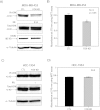
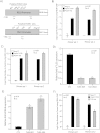
Molecular apocrine is a subtype of estrogen receptor-negative (ER.) breast cancer, which is characterized by a steroid-response gene signature that includes androgen receptor, FOXA1, and a high frequency of ErbB2 overexpression. In this study, we demonstrate that there is a strong association between the overexpression of FOXA1 and ErbB2 in ER- breast tumors. This has led us to identify a cross-regulation network between FOXA1 and ErbB2 signaling in ER- breast cancer. We present two mechanisms to explain the association between FOXA1 and ErbB2 overexpression in molecular apocrine cells. In one process, ErbB2 signaling genes CREB1 and c-Fos regulate FOXA1 transcription, and in another process, AP2α regulates the expression of both FOXA1 and ErbB2. Moreover, we demonstrate that FOXA1, in turn, regulates the transcription of ErbB2 signaling genes. This includes a core gene signature that is shared across two molecular apocrine cell lines. Importantly, the most upregulated (RELB) and downregulated (PAK1) genes in this signature are direct FOXA1 targets. Our data suggest that FOXA1 acts as a dual-function transcription factor and the repressive function of FOXA1 on RELB can be explained by the recruitment of its binding partner corepressor TLE3. It is notable that a group of FOXA1-regulated genes vary across molecular apocrine cell lines leading to the differences in the functional effects of FOXA1 on extracellular signal-regulated kinase phosphorylation and cell viability between these lines. This study demonstrates that there is a cross-regulation network between FOXA1 and ErbB2 signaling that connects FOXA1 to some of the key signaling pathways in ER-breast cancer.
Figures

Similar articles
-
A feedback loop between androgen receptor and ERK signaling in estrogen receptor-negative breast cancer.Neoplasia. 2011 Feb;13(2):154-66. doi: 10.1593/neo.101324. Neoplasia. 2011. PMID: 21403841 Free PMC article.
-
Prolactin-induced protein mediates cell invasion and regulates integrin signaling in estrogen receptor-negative breast cancer.Breast Cancer Res. 2012 Jul 20;14(4):R111. doi: 10.1186/bcr3232. Breast Cancer Res. 2012. PMID: 22817771 Free PMC article.
-
Synergy between inhibitors of androgen receptor and MEK has therapeutic implications in estrogen receptor-negative breast cancer.Breast Cancer Res. 2011 Apr 1;13(2):R36. doi: 10.1186/bcr2858. Breast Cancer Res. 2011. PMID: 21457548 Free PMC article.
-
FOXA1: a transcription factor with parallel functions in development and cancer.Biosci Rep. 2012 Apr 1;32(2):113-30. doi: 10.1042/BSR20110046. Biosci Rep. 2012. PMID: 22115363 Free PMC article. Review.
-
Molecular mechanisms regulating the hormone sensitivity of breast cancer.Cancer Sci. 2014 Nov;105(11):1377-83. doi: 10.1111/cas.12521. Epub 2014 Oct 29. Cancer Sci. 2014. PMID: 25155268 Free PMC article. Review.
Cited by
-
cAMP responsive element binding protein-1 is a transcription factor of lysosomal-associated protein transmembrane-4 Beta in human breast cancer cells.PLoS One. 2013;8(2):e57520. doi: 10.1371/journal.pone.0057520. Epub 2013 Feb 28. PLoS One. 2013. PMID: 23469012 Free PMC article.
-
The Discovery of Novel Biomarkers Improves Breast Cancer Intrinsic Subtype Prediction and Reconciles the Labels in the METABRIC Data Set.PLoS One. 2015 Jul 1;10(7):e0129711. doi: 10.1371/journal.pone.0129711. eCollection 2015. PLoS One. 2015. PMID: 26132585 Free PMC article.
-
Coagulation factor VII is regulated by androgen receptor in breast cancer.Exp Cell Res. 2015 Feb 1;331(1):239-250. doi: 10.1016/j.yexcr.2014.10.002. Epub 2014 Oct 14. Exp Cell Res. 2015. PMID: 25447311 Free PMC article.
-
Overcoming intratumor heterogeneity of polygenic cancer drug resistance with improved biomarker integration.Neoplasia. 2012 Dec;14(12):1278-89. doi: 10.1593/neo.122096. Neoplasia. 2012. PMID: 23308059 Free PMC article.
-
FOXA1 and adaptive response determinants to HER2 targeted therapy in TBCRC 036.NPJ Breast Cancer. 2021 May 12;7(1):51. doi: 10.1038/s41523-021-00258-0. NPJ Breast Cancer. 2021. PMID: 33980863 Free PMC article.
References
-
- Putti TC, El-Rehim DM, Rakha EA, Paish CE, Lee AH, Pinder SE, Ellis IO. Estrogen receptor-negative breast carcinomas: a review of morphology and immunophenotypical analysis. Mod Pathol. 2005;18:26–35. - PubMed
-
- Farmer P, Bonnefoi H, Becette V, Tubiana-Hulin M, Fumoleau P, Larsimont D, Macgrogan G, Bergh J, Cameron D, Goldstein D, et al. Identification of molecular apocrine breast tumours by microarray analysis. Oncogene. 2005;24:4660–4671. - PubMed
-
- Teschendorff AE, Naderi A, Barbosa-Morais NL, Caldas C. PACK: profile analysis using clustering and kurtosis to find molecular classifiers in cancer. Bioinformatics. 2006;15:2269–2275. - PubMed
-
- Doane AS, Danso M, Lal P, Donaton M, Zhang L, Hudis C, Gerald WL. An estrogen receptor-negative breast cancer subset characterized by a hormonally regulated transcriptional program and response to androgen. Oncogene. 2006;25:3994–4008. - PubMed
-
- Park S, Koo J, Park HS, Kim JH, Choi SY, Lee JH, Park BW, Lee KS. Expression of androgen receptors in primary breast cancer. Ann Oncol. 2010;21:488–492. - PubMed
Publication types
MeSH terms
Substances
LinkOut - more resources
Full Text Sources
Medical
Research Materials
Miscellaneous
