. 2012 Feb 23;1(2):167-78.
doi: 10.1016/j.celrep.2012.02.001.

Integrative genome-wide analysis reveals cooperative regulation of alternative splicing by hnRNP proteins

Affiliations

Integrative genome-wide analysis reveals cooperative regulation of alternative splicing by hnRNP proteins

Stephanie C Huelga et al. Cell Rep. .

Abstract

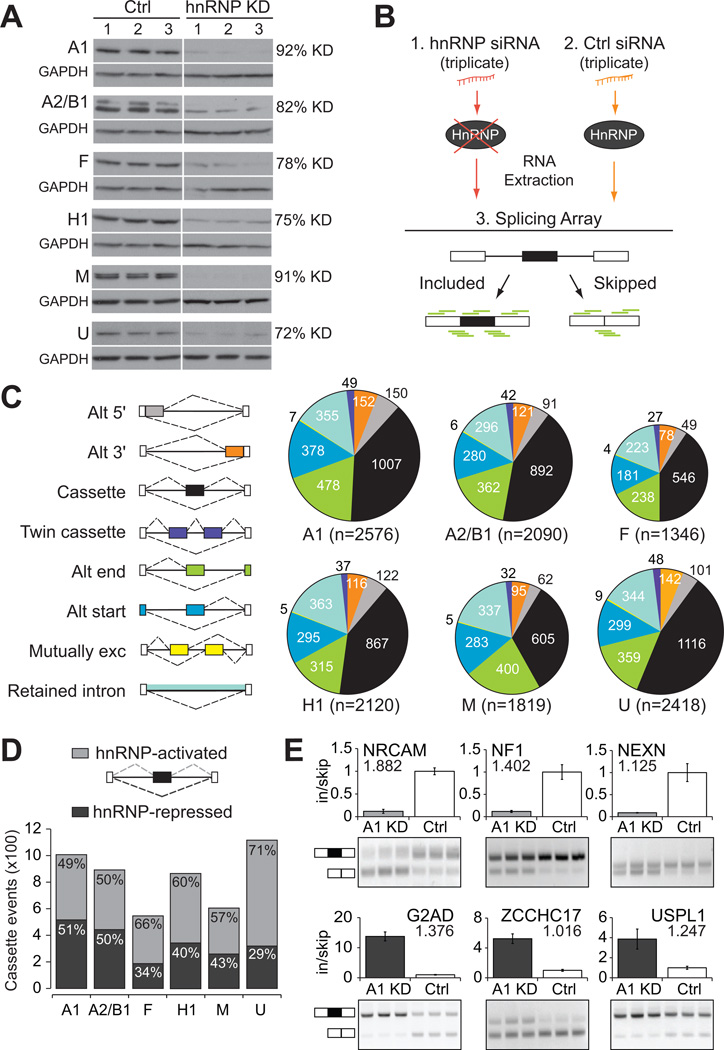
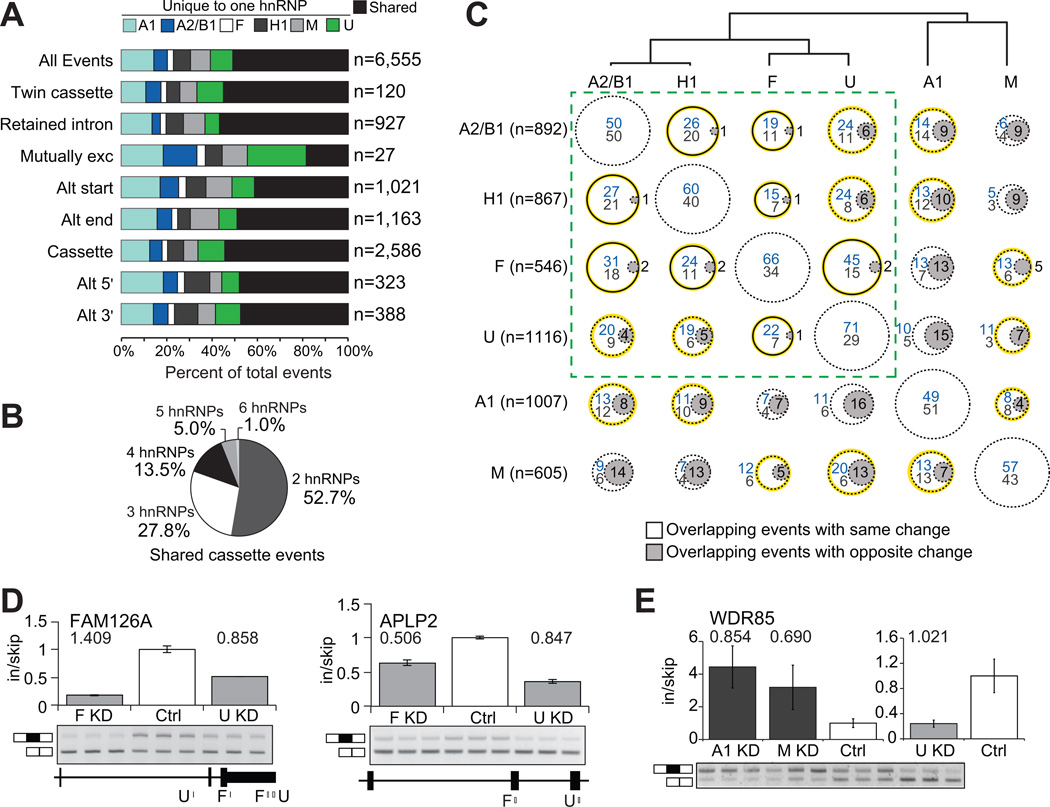
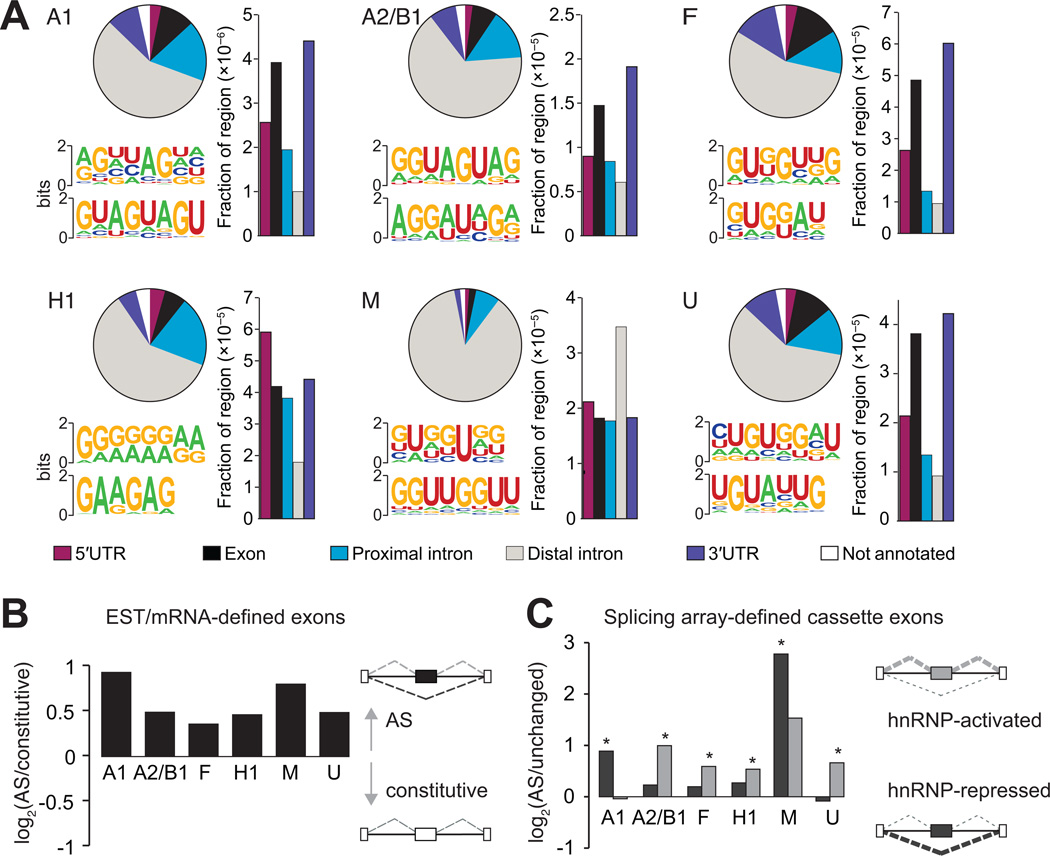
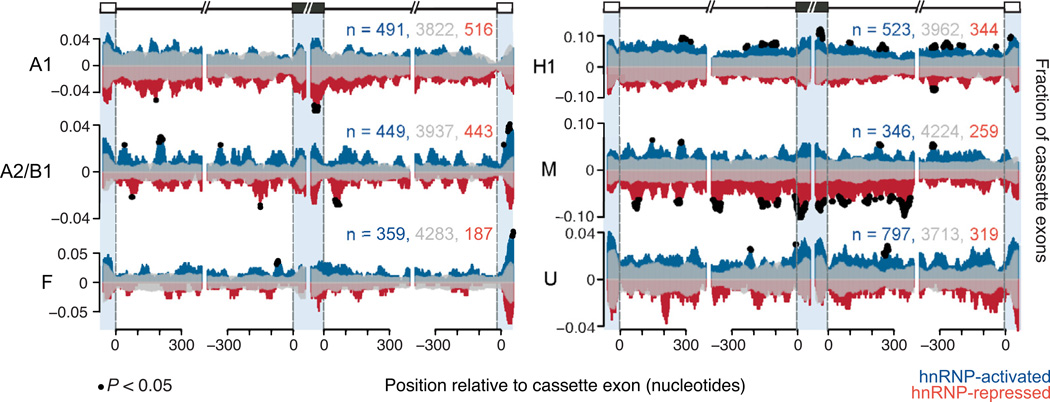
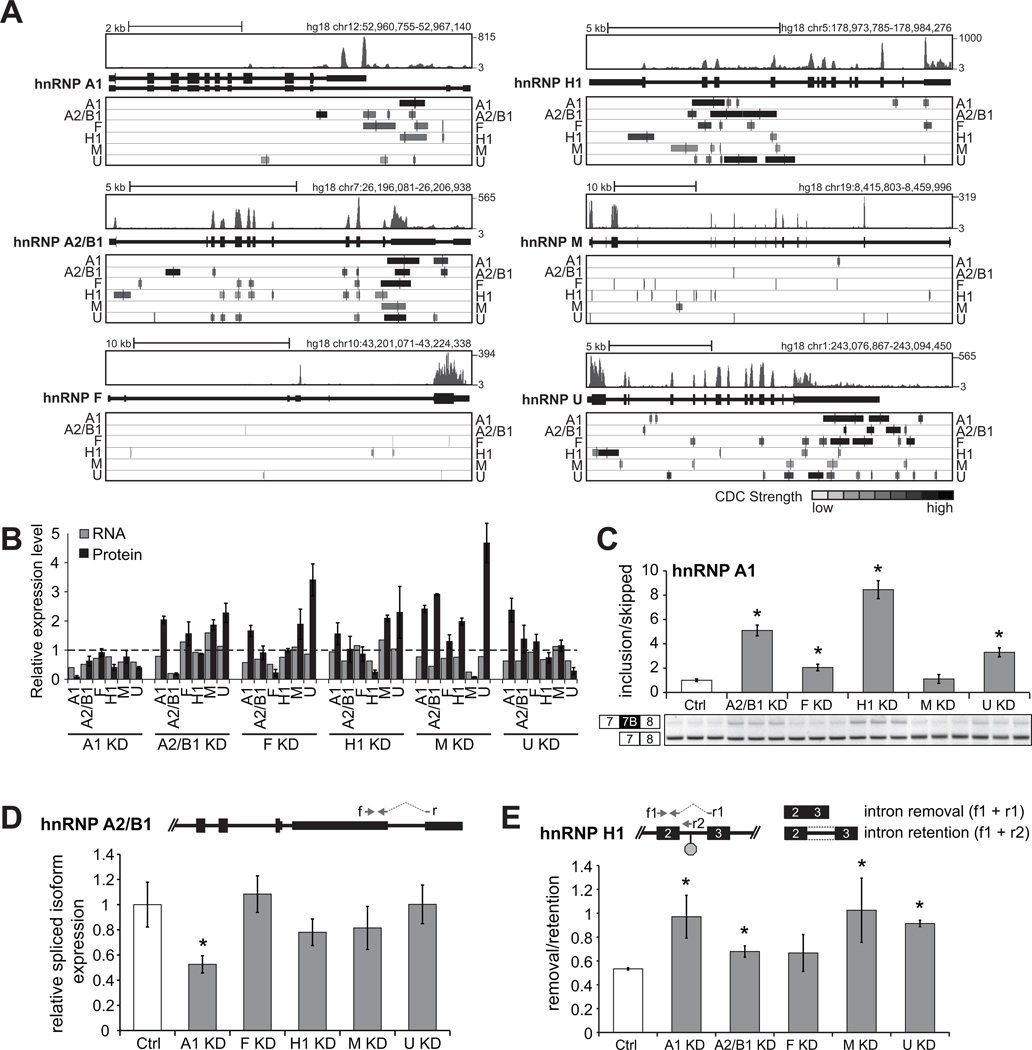
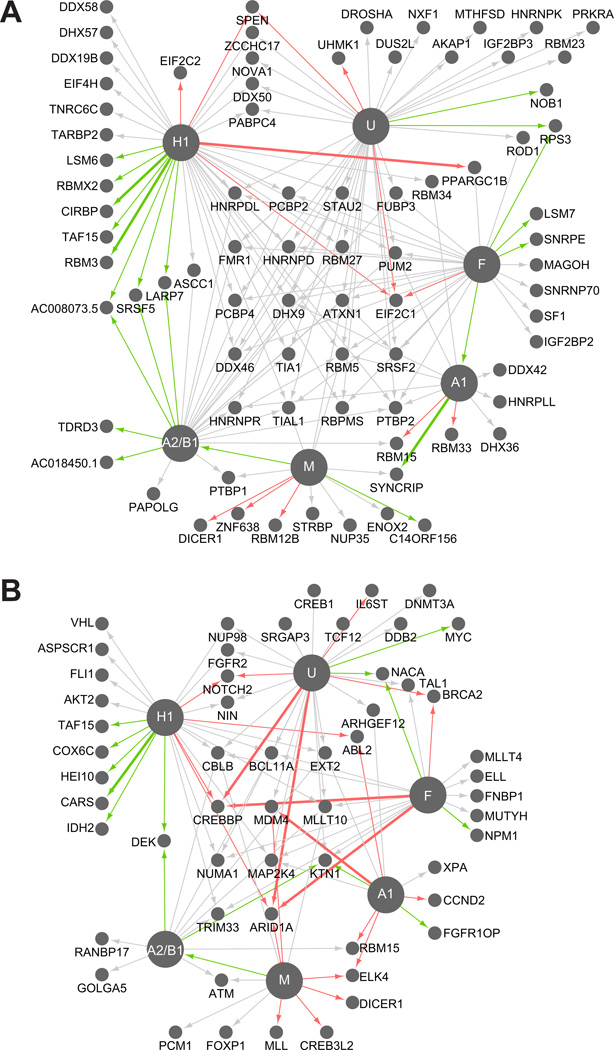
Understanding how RNA binding proteins control the splicing code is fundamental to human biology and disease. Here, we present a comprehensive study to elucidate how heterogeneous nuclear ribonucleoparticle (hnRNP) proteins, among the most abundant RNA binding proteins, coordinate to regulate alternative pre-mRNA splicing (AS) in human cells. Using splicing-sensitive microarrays, crosslinking and immunoprecipitation coupled with high-throughput sequencing (CLIP-seq), and cDNA sequencing, we find that more than half of all AS events are regulated by multiple hnRNP proteins and that some combinations of hnRNP proteins exhibit significant synergy, whereas others act antagonistically. Our analyses reveal position-dependent RNA splicing maps, in vivo consensus binding sites, a surprising level of cross- and autoregulation among hnRNP proteins, and the coordinated regulation by hnRNP proteins of dozens of other RNA binding proteins and genes associated with cancer. Our findings define an unprecedented degree of complexity and compensatory relationships among hnRNP proteins and their splicing targets that likely confer robustness to cells.


Figures

Figure 1
Figure 1. Thousands of hnRNP-dependent alternative splicing events identified in human cells
(A) Western analysis demonstrating successful depletion of hnRNP proteins A1, A2/B1, F, H1, M, and U in human 293T cells in triplicate experiments. GAPDH was used as a loading control. The extent of protein depletion was quantified by densitometric analysis. (B) Experimental strategy for identification of alternative splicing (AS) events. Total RNA was extracted from human 293T cells treated with (1) hnRNP-targeting siRNA(s), or (2) a control non-targeting siRNA, and (3) was subjected to splicing-sensitive microarrays (probes depicted in green). (C) Pie charts of differentially regulated AS events as detected by splicing arrays. Colors represent the types of AS events that were detected and the size of each pie chart reflects the number of events detected. (D) Cassette exons differentially regulated upon depletion of individual hnRNP proteins, relative to control. Bars are divided to display the proportion of events that are less included upon depletion (hnRNP-activated, light gray), or more included upon depletion (hnRNP-repressed, dark gray). (E) RT-PCR validation of hnRNP A1-regulated cassette exons (P < 0.01, t-test). Light gray indicates activation of exon inclusion and dark gray indicated repression of exon inclusion. Absolute separation score predicted by the splicing array analysis is listed below the affected gene name. Bar plots represent densitometric analysis of bands and error bars are standard deviations within triplicate experiments (See also Figure S1).
Figure 2
Figure 2. Multiple hnRNP proteins co-regulate AS events
(A) For each type of AS event, the percentage of events that was affected in more than one hnRNP depletion is in black, and the percentage of events that was affected uniquely in a single hnRNP depletion. (B) Distribution of shared cassette exons affected by 2 to 6 hnRNP proteins. (C) Comparisons of the overlap and directionality of cassette exons affected by pairs of hnRNP proteins. The dendrogram displays the hierarchical clustering of all cassette exons regulated by each hnRNP protein. Circles represent the percent of overlapping events for the hnRNP in the row, with the hnRNP listed in the column. Circles with gray shading indicate overlapping events that were affected in opposing directions (depletion of one hnRNP protein leads to inclusion and depletion of the other hnRNP leads to skipping). For cassette exons that were affected in the same direction, blue values indicates the percentage of events that were hnRNP-activated while values in gray listed below represent percentage that were hnRNP-repressed. The solid black lines represent significant overlap of targets (P < 0.05, hypergeometric test) and the yellow highlighting denotes overlapping cassettes that are significantly changing in the same direction (P < 0.002, hypergeometric test). The dashed-line box contains the hnRNP proteins that are most similar. (D) RT-PCR validations of cassette exons affected in the same direction upon depletion of hnRNP F or hnRNP U (P < 0.01, t-test). Binding of hnRNP F and U near the cassette exon is shown below. (E) RT-PCR validation of a cassette exon similarly affected by depletion of hnRNPA1 or hnRNP M, but opposite from the change caused by depletion of hnRNP U (P < 0.05, t-test). Absolute separation score as predicted by the splicing array analysis is listed above the bars. Bar plots represent densitometric analysis of bands and error bars are standard deviations in triplicate experiments (See also Figure S2).
Figure 3
Figure 3. HnRNP proteins bind to sequence motifs in vivo and are enriched near regulated exons
(A) Distribution of hnRNP binding sites within different categories of genic regions (pie charts). Bar plots represent the fraction of a particular region bound, relative to the total genomic size of the region. The most representative top motifs identified by the HOMER algorithm are also shown. (B) Preference for hnRNP protein binding near expressed sequence tag (EST) or mRNA-defined cassette exons. The y-axis is the log2 ratio of the fraction of 41,754 cassette exons to the fraction of 222,125 constitutive exons harboring hnRNP binding clusters within 2 kilobases (kb) of the exon. All bars are significant (P < 10−28, Fisher exact test). (C) Preference for hnRNP proteins to bind proximal to splicing array-defined cassette exons that are activated or repressed by a specific hnRNP protein. The y-axis is the log2 ratio of the fraction of changed cassette exons to the fraction of unchanged cassette exons having hnRNP binding clusters within 2 kb of the exon. Dark gray bars represent the preference for hnRNP-repressed compared to unaffected exons and light gray bars represent the preference for hnRNP-activated compared to unaffected exons. A single asterisk denotes the most significant binding preference (P < 0.05, Fisher exact test). (See also Figure S3).
Figure 4
Figure 4. HnRNP proteins bind in a position-specific manner around cassette exons
RNA splicing maps showing the fraction of microarray-detected cassette exons with CLIP-seq reads located proximal to activated (positive y-axis, blue), repressed (negative y-axis, red), and unaffected cassette exons (reflected on positive and negative y-axis, transparent gray). The x-axis represents nucleotide position relative to upstream, cassette and downstream exons. Blue shading separates positions that fall in the upstream exon (left, −50-0), in the cassette exon (middle left, 0–50, middle right, −50-0) and in the downstream exon (right, 0–50). Black dots represent nucleotide positions where significantly more hnRNP-activated cassette exons or hnRNP-repressed cassette exons showed binding, compared to unchanged cassette exons (P < 0.05, chi-square test). The total counts for activated, unaffected, and repressed exons that were used to generate the maps are listed. (See also Figure S4).
Figure 5
Figure 5. Cross-regulation of hnRNP proteins adds complexity to splicing regulation
(A) CLIP-derived clusters (CDCs) identified for each hnRNP within each of the 6 hnRNP gene structures. CDCs are shaded according to strength of binding, where darker shading indicates more significant read coverage. RNA-seq read distributions in control siRNA treated 293T cells are shown above each hnRNP gene structure. (B) Quantification of hnRNP protein abundance (based on densitometric measurements of Figure S5 bands) and RNA abundance (based on RNA-seq RPKMs) within the context of the different hnRNP depletion conditions. Y-values are fold-changes over the control protein and RNA levels. (C) RT-PCR splicing validation of hnRNP A1 exon 7B in each of the hnRNP KD experiments. Bars represent densitometric measurements of bands relative to control. Significant changes relative to control are starred (P < 0.002, t-test). (D) Relative expression of an hnRNP A2/B1 spliced 3’UTR NMD candidate isoform in each of the hnRNP KD experiments. Primers ‘f’ and ‘r’ are depicted. Bars represent an average abundance by qRT-PCR across triplicate KD experiments, relative to control. All measurements were normalized to GAPDH expression. Significant changes relative to control are starred (P < 0.001, t-test). (E) Ratio of relative hnRNP H1 isoform expression with intron removed (measured with primers f1 and r1 depicted) compared to relative hnRNP H1 isoform expression with intron retained (measured with primers f1 and r2 depicted) in each of the hnRNP KD conditions. Bars represent an average abundance by qRT-PCR across triplicate KD experiments relative to control. All measurements are normalized to GAPDH expression. Asterisks denote significant changes relative to control (P < 0.04, t-test).
Figure 6
Figure 6. HnRNP proteins regulate other RBPs and cancer-associated transcripts
Connectivity diagrams of hnRNP-regulated and hnRNP-bound (A) RNA binding protein transcripts or (B) cancer-associated transcripts. Nodes represent hnRNP RNA targets and the hnRNP nodes are enlarged for emphasis. Each edge represents an hnRNP target that is both bound directly and regulated, colored according to the type of regulation. Gray represents that the gene contains a cassette exon that changes upon depletion of the hnRNP. Red and green edges reflect up and down-regulation of mRNA levels upon depletion of the hnRNP. Thicker edges represent genes with both an alternative cassette and an expression change. (See also Figure S6)

Similar articles

Cited by

References

    1. Black DL. Mechanisms of alternative pre-messenger RNA splicing. Annu Rev Biochem. 2003;72:291–336. - PubMed
    1. Blanchette M, Chabot B. Modulation of exon skipping by high-affinity hnRNP A1-binding sites and by intron elements that repress splice site utilization. EMBO J. 1999;18:1939–1952. - PMC - PubMed
    1. Blanchette M, Green RE, MacArthur S, Brooks AN, Brenner SE, Eisen MB, Rio DC. Genome-wide analysis of alternative pre-mRNA splicing and RNA-binding specificities of the Drosophila hnRNP A/B family members. Mol Cell. 2009;33:438–449. - PMC - PubMed
    1. Burd CG, Dreyfuss G. RNA binding specificity of hnRNP A1: significance of hnRNP A1 high-affinity binding sites in pre-mRNA splicing. EMBO J. 1994;13:1197–1204. - PMC - PubMed
    1. Caputi M, Zahler AM. Determination of the RNA binding specificity of the heterogeneous nuclear ribonucleoprotein (hnRNP) H/H'/F/2H9 family. J Biol Chem. 2001;276:43850–43859. - PubMed

Publication types

MeSH terms

Substances

Associated data