

Adaptive optics retinal imaging in the living mouse eye
- PMID: 22574260
- PMCID: PMC3345801
- DOI: 10.1364/BOE.3.000715
Adaptive optics retinal imaging in the living mouse eye
Abstract
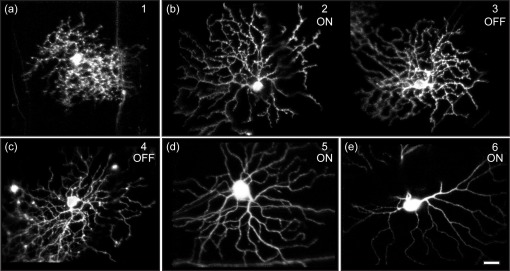
Correction of the eye's monochromatic aberrations using adaptive optics (AO) can improve the resolution of in vivo mouse retinal images [Biss et al., Opt. Lett. 32(6), 659 (2007) and Alt et al., Proc. SPIE 7550, 755019 (2010)], but previous attempts have been limited by poor spot quality in the Shack-Hartmann wavefront sensor (SHWS). Recent advances in mouse eye wavefront sensing using an adjustable focus beacon with an annular beam profile have improved the wavefront sensor spot quality [Geng et al., Biomed. Opt. Express 2(4), 717 (2011)], and we have incorporated them into a fluorescence adaptive optics scanning laser ophthalmoscope (AOSLO). The performance of the instrument was tested on the living mouse eye, and images of multiple retinal structures, including the photoreceptor mosaic, nerve fiber bundles, fine capillaries and fluorescently labeled ganglion cells were obtained. The in vivo transverse and axial resolutions of the fluorescence channel of the AOSLO were estimated from the full width half maximum (FWHM) of the line and point spread functions (LSF and PSF), and were found to be better than 0.79 μm ± 0.03 μm (STD)(45% wider than the diffraction limit) and 10.8 μm ± 0.7 μm (STD)(two times the diffraction limit), respectively. The axial positional accuracy was estimated to be 0.36 μm. This resolution and positional accuracy has allowed us to classify many ganglion cell types, such as bistratified ganglion cells, in vivo.
Keywords: (110.1080) Active or adaptive optics; (170.4460) Ophthalmic optics and devices; (330.7324) Visual optics, comparative animal models.
Figures


Similar articles
-
In vivo imaging of microscopic structures in the rat retina.Invest Ophthalmol Vis Sci. 2009 Dec;50(12):5872-9. doi: 10.1167/iovs.09-3675. Epub 2009 Jul 2. Invest Ophthalmol Vis Sci. 2009. PMID: 19578019 Free PMC article.
-
Optical properties of the mouse eye.Biomed Opt Express. 2011 Feb 28;2(4):717-38. doi: 10.1364/BOE.2.000717. Biomed Opt Express. 2011. PMID: 21483598 Free PMC article.
-
Wide-vergence, multi-spectral adaptive optics scanning laser ophthalmoscope with diffraction-limited illumination and collection.Biomed Opt Express. 2020 Feb 26;11(3):1617-1632. doi: 10.1364/BOE.384229. eCollection 2020 Mar 1. Biomed Opt Express. 2020. PMID: 32206432 Free PMC article.
-
The Development of Adaptive Optics and Its Application in Ophthalmology.2019 Aug 14. In: Bille JF, editor. High Resolution Imaging in Microscopy and Ophthalmology: New Frontiers in Biomedical Optics [Internet]. Cham (CH): Springer; 2019. Chapter 16. 2019 Aug 14. In: Bille JF, editor. High Resolution Imaging in Microscopy and Ophthalmology: New Frontiers in Biomedical Optics [Internet]. Cham (CH): Springer; 2019. Chapter 16. PMID: 32091847 Free Books & Documents. Review.
-
VioBio lab adaptive optics: technology and applications by women vision scientists.Ophthalmic Physiol Opt. 2020 Mar;40(2):75-87. doi: 10.1111/opo.12677. Epub 2020 Mar 8. Ophthalmic Physiol Opt. 2020. PMID: 32147855 Review.
Cited by
-
Image metric-based multi-observation single-step deep deterministic policy gradient for sensorless adaptive optics.Biomed Opt Express. 2024 Jul 23;15(8):4795-4814. doi: 10.1364/BOE.528579. eCollection 2024 Aug 1. Biomed Opt Express. 2024. PMID: 39346980 Free PMC article.
-
Non-invasive cellular-resolution retinal imaging with two-photon excited fluorescence.Biomed Opt Express. 2019 Aug 27;10(9):4859-4873. doi: 10.1364/BOE.10.004859. eCollection 2019 Sep 1. Biomed Opt Express. 2019. PMID: 31565530 Free PMC article.
-
From mouse to human: Accessing the biochemistry of vision in vivo by two-photon excitation.Prog Retin Eye Res. 2023 Mar;93:101170. doi: 10.1016/j.preteyeres.2023.101170. Epub 2023 Feb 12. Prog Retin Eye Res. 2023. PMID: 36787681 Free PMC article. Review.
-
Contrast-based sensorless adaptive optics for retinal imaging.Biomed Opt Express. 2015 Aug 26;6(9):3577-95. doi: 10.1364/BOE.6.003577. eCollection 2015 Sep 1. Biomed Opt Express. 2015. PMID: 26417525 Free PMC article.
-
Optical modelling of a supplementary tunable air-spaced goggle lens for rodent eye imaging.PLoS One. 2017 Jul 20;12(7):e0181111. doi: 10.1371/journal.pone.0181111. eCollection 2017. PLoS One. 2017. PMID: 28727809 Free PMC article.
References
-
- Libby R. T., Anderson M. G., Pang I. H., Robinson Z. H., Savinova O. V., Cosma I. M., Snow A., Wilson L. A., Smith R. S., Clark A. F., John S. W., “Inherited glaucoma in DBA/2J mice: pertinent disease features for studying the neurodegeneration,” Vis. Neurosci. 22(05), 637–648 (2005).10.1017/S0952523805225130 - DOI - PubMed
-
- Seeliger M. W., Beck S. C., Pereyra-Muñoz N., Dangel S., Tsai J. Y., Luhmann U. F., van de Pavert S. A., Wijnholds J., Samardzija M., Wenzel A., Zrenner E., Narfström K., Fahl E., Tanimoto N., Acar N., Tonagel F., “In vivo confocal imaging of the retina in animal models using scanning laser ophthalmoscopy,” Vision Res. 45(28), 3512–3519 (2005).10.1016/j.visres.2005.08.014 - DOI - PubMed
Grants and funding
LinkOut - more resources
Full Text Sources
Other Literature Sources
Research Materials