

Targeted overexpression of inducible 6-phosphofructo-2-kinase in adipose tissue increases fat deposition but protects against diet-induced insulin resistance and inflammatory responses
- PMID: 22556414
- PMCID: PMC3375570
- DOI: 10.1074/jbc.M112.370379
Targeted overexpression of inducible 6-phosphofructo-2-kinase in adipose tissue increases fat deposition but protects against diet-induced insulin resistance and inflammatory responses
Abstract
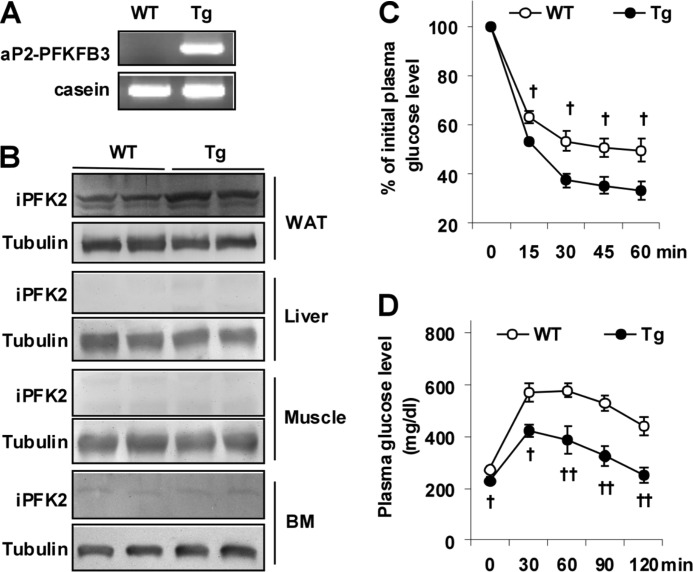
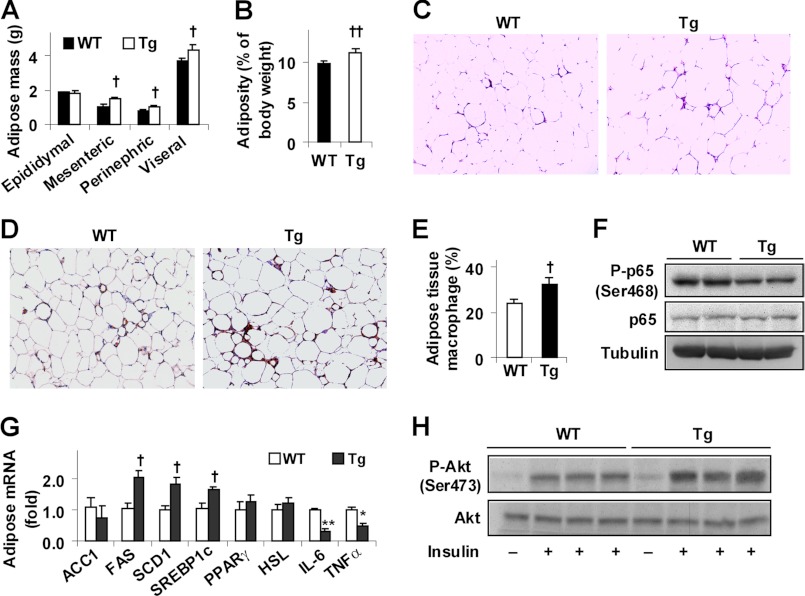
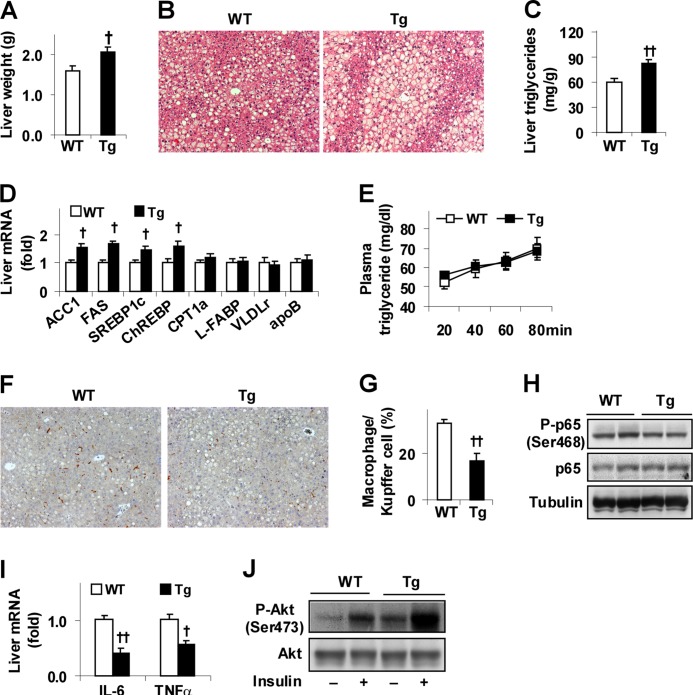
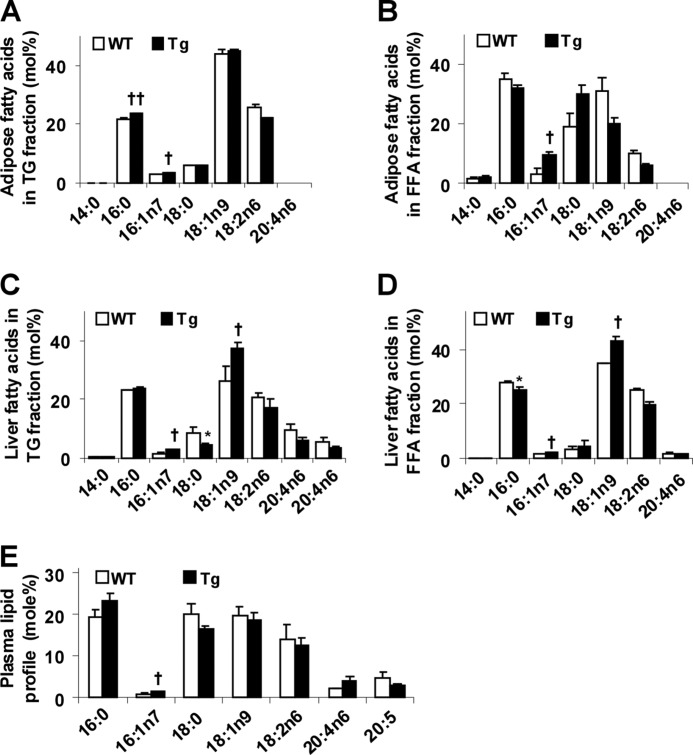
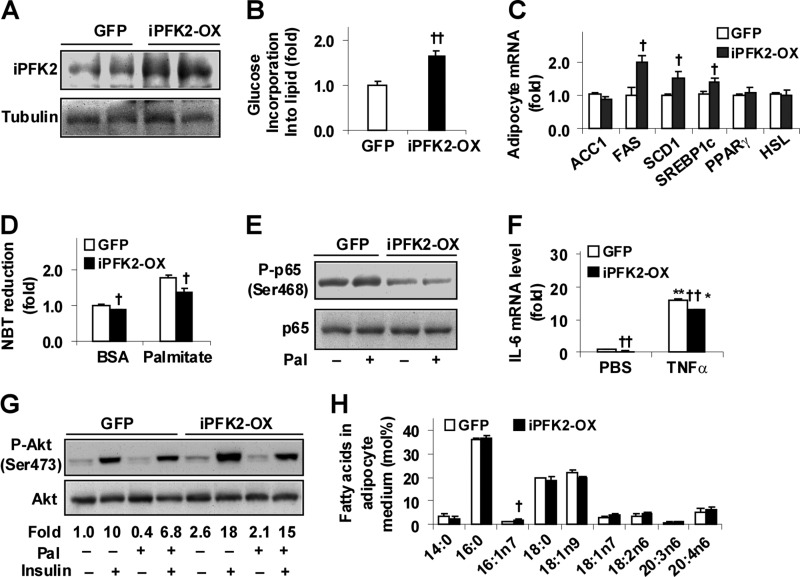
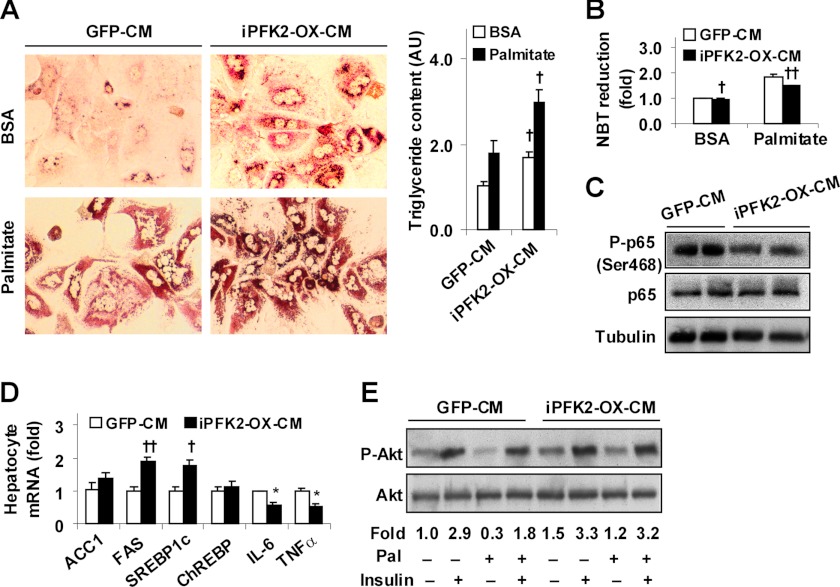
Increasing evidence demonstrates the dissociation of fat deposition, the inflammatory response, and insulin resistance in the development of obesity-related metabolic diseases. As a regulatory enzyme of glycolysis, inducible 6-phosphofructo-2-kinase (iPFK2, encoded by PFKFB3) protects against diet-induced adipose tissue inflammatory response and systemic insulin resistance independently of adiposity. Using aP2-PFKFB3 transgenic (Tg) mice, we explored the ability of targeted adipocyte PFKFB3/iPFK2 overexpression to modulate diet-induced inflammatory responses and insulin resistance arising from fat deposition in both adipose and liver tissues. Compared with wild-type littermates (controls) on a high fat diet (HFD), Tg mice exhibited increased adiposity, decreased adipose inflammatory response, and improved insulin sensitivity. In a parallel pattern, HFD-fed Tg mice showed increased hepatic steatosis, decreased liver inflammatory response, and improved liver insulin sensitivity compared with controls. In both adipose and liver tissues, increased fat deposition was associated with lipid profile alterations characterized by an increase in palmitoleate. Additionally, plasma lipid profiles also displayed an increase in palmitoleate in HFD-Tg mice compared with controls. In cultured 3T3-L1 adipocytes, overexpression of PFKFB3/iPFK2 recapitulated metabolic and inflammatory changes observed in adipose tissue of Tg mice. Upon treatment with conditioned medium from iPFK2-overexpressing adipocytes, mouse primary hepatocytes displayed metabolic and inflammatory responses that were similar to those observed in livers of Tg mice. Together, these data demonstrate a unique role for PFKFB3/iPFK2 in adipocytes with regard to diet-induced inflammatory responses in both adipose and liver tissues.
Figures
Similar articles
-
Adipocyte inducible 6-phosphofructo-2-kinase suppresses adipose tissue inflammation and promotes macrophage anti-inflammatory activation.J Nutr Biochem. 2021 Sep;95:108764. doi: 10.1016/j.jnutbio.2021.108764. Epub 2021 May 6. J Nutr Biochem. 2021. PMID: 33964465 Free PMC article.
-
Disruption of inducible 6-phosphofructo-2-kinase ameliorates diet-induced adiposity but exacerbates systemic insulin resistance and adipose tissue inflammatory response.J Biol Chem. 2010 Feb 5;285(6):3713-3721. doi: 10.1074/jbc.M109.058446. Epub 2009 Nov 30. J Biol Chem. 2010. PMID: 19948719 Free PMC article.
-
Disruption of inducible 6-phosphofructo-2-kinase impairs the suppressive effect of PPARγ activation on diet-induced intestine inflammatory response.J Nutr Biochem. 2013 May;24(5):770-5. doi: 10.1016/j.jnutbio.2012.04.007. Epub 2012 Jul 26. J Nutr Biochem. 2013. PMID: 22841546 Free PMC article.
-
How does high-fat diet induce adipose tissue fibrosis?J Investig Med. 2012 Dec;60(8):1147-50. doi: 10.2310/JIM.0b013e318271fdb9. J Investig Med. 2012. PMID: 23072903 Free PMC article. Review.
-
The Role of the Novel Lipokine Palmitoleic Acid in Health and Disease.Adv Nutr. 2017 Jan 17;8(1):173S-181S. doi: 10.3945/an.115.011130. Print 2017 Jan. Adv Nutr. 2017. PMID: 28096141 Free PMC article. Review.
Cited by
-
Exercise Rescues Gene Pathways Involved in Vascular Expansion and Promotes Functional Angiogenesis in Subcutaneous White Adipose Tissue.Int J Mol Sci. 2019 Apr 25;20(8):2046. doi: 10.3390/ijms20082046. Int J Mol Sci. 2019. PMID: 31027261 Free PMC article.
-
Disuse-induced insulin resistance susceptibility coincides with a dysregulated skeletal muscle metabolic transcriptome.J Appl Physiol (1985). 2019 May 1;126(5):1419-1429. doi: 10.1152/japplphysiol.01093.2018. Epub 2019 Feb 14. J Appl Physiol (1985). 2019. PMID: 30763167 Free PMC article.
-
Adipocyte inducible 6-phosphofructo-2-kinase suppresses adipose tissue inflammation and promotes macrophage anti-inflammatory activation.J Nutr Biochem. 2021 Sep;95:108764. doi: 10.1016/j.jnutbio.2021.108764. Epub 2021 May 6. J Nutr Biochem. 2021. PMID: 33964465 Free PMC article.
-
A role for PFKFB3/iPFK2 in metformin suppression of adipocyte inflammatory responses.J Mol Endocrinol. 2017 Jul;59(1):49-59. doi: 10.1530/JME-17-0066. J Mol Endocrinol. 2017. PMID: 28559290 Free PMC article.
-
CDK6 inhibits de novo lipogenesis in white adipose tissues but not in the liver.Nat Commun. 2024 Feb 5;15(1):1091. doi: 10.1038/s41467-024-45294-z. Nat Commun. 2024. PMID: 38316780 Free PMC article.
References
-
- Tilg H., Hotamisligil G. S. (2006) Nonalcoholic fatty liver disease. Cytokine-adipokine interplay and regulation of insulin resistance. Gastroenterology 131, 934–945 - PubMed
-
- Menghini R., Menini S., Amoruso R., Fiorentino L., Casagrande V., Marzano V., Tornei F., Bertucci P., Iacobini C., Serino M., Porzio O., Hribal M. L., Folli F., Khokha R., Urbani A., Lauro R., Pugliese G., Federici M. (2009) Tissue inhibitor of metalloproteinase 3 deficiency causes hepatic steatosis and adipose tissue inflammation in mice. Gastroenterology 136, 663–672 - PubMed
-
- Iozzo P., Bucci M., Roivainen A., Någren K., Järvisalo M. J., Kiss J., Guiducci L., Fielding B., Naum A. G., Borra R., Virtanen K., Savunen T., Salvadori P. A., Ferrannini E., Knuuti J., Nuutila P. (2010) Fatty acid metabolism in the liver, measured by positron emission tomography, is increased in obese individuals. Gastroenterology 139, 846–856 - PubMed
Publication types
MeSH terms
Substances
Grants and funding
LinkOut - more resources
Full Text Sources
Medical
Molecular Biology Databases
Research Materials
Miscellaneous
