Transient interactions of a slow-folding protein with the Hsp70 chaperone machinery
- PMID: 22549943
- PMCID: PMC3403441
- DOI: 10.1002/pro.2087
Transient interactions of a slow-folding protein with the Hsp70 chaperone machinery
Abstract
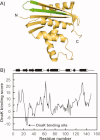
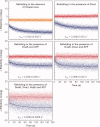
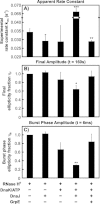
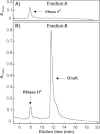
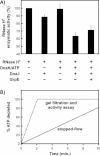
Most known proteins have at least one local Hsp70 chaperone binding site. Does this mean that all proteins interact with Hsp70 as they fold? This study makes an initial step to address the above question by examining the interaction of the E.coli Hsp70 chaperone (known as DnaK) and its co-chaperones DnaJ and GrpE with a slow-folding E.coli substrate, RNase H(D). Importantly, this protein is a nonobligatory client, and it is able to fold in vitro even in the absence of chaperones. We employ stopped-flow mixing, chromatography, and activity assays to analyze the kinetic perturbations induced by DnaK/DnaJ/GrpE (K/J/E) on the folding of RNase H(D). We find that K/J/E slows down RNase H(D)'s apparent folding, consistent with the presence of transient chaperone-substrate interactions. However, kinetic retardation is moderate for this slow-folding client and it is expected to be even smaller for faster-folding substrates. Given that the interaction of folding-competent substrates such as RNase H(D) with the K/J/E chaperones is relatively short-lived, it does not significantly interfere with the timely production of folded biologically active substrate. The above mode of action is important because it preserves K/J/E bioavailability, enabling this chaperone system to act primarily by assisting the folding of other misfolded and (or) aggregation-prone cellular proteins that are unable to fold independently. When refolding is carried out in the presence of K/J and absence of the nucleotide exchange factor GrpE, some of the substrate population becomes trapped as a chaperone-bound partially unfolded state.
Copyright © 2012 The Protein Society.
Figures



Similar articles
-
Protein folding rates and thermodynamic stability are key determinants for interaction with the Hsp70 chaperone system.Protein Sci. 2012 Oct;21(10):1489-502. doi: 10.1002/pro.2139. Protein Sci. 2012. PMID: 22886941 Free PMC article.
-
Regulation of ATPase and chaperone cycle of DnaK from Thermus thermophilus by the nucleotide exchange factor GrpE.J Mol Biol. 2001 Feb 2;305(5):1173-83. doi: 10.1006/jmbi.2000.4373. J Mol Biol. 2001. PMID: 11162122
-
Bacterial Hsp70 resolves misfolded states and accelerates productive folding of a multi-domain protein.Nat Commun. 2020 Jan 17;11(1):365. doi: 10.1038/s41467-019-14245-4. Nat Commun. 2020. PMID: 31953415 Free PMC article.
-
Interferon-gamma is a target for binding and folding by both Escherichia coli chaperone model systems GroEL/GroES and DnaK/DnaJ/GrpE.Biochimie. 1998 Aug-Sep;80(8-9):729-37. doi: 10.1016/s0300-9084(99)80026-1. Biochimie. 1998. PMID: 9865495 Review.
-
Hsp90 and Hsp70 chaperones: Collaborators in protein remodeling.J Biol Chem. 2019 Feb 8;294(6):2109-2120. doi: 10.1074/jbc.REV118.002806. Epub 2018 Nov 6. J Biol Chem. 2019. PMID: 30401745 Free PMC article. Review.
Cited by
-
Heterogeneous binding of the SH3 client protein to the DnaK molecular chaperone.Proc Natl Acad Sci U S A. 2015 Aug 4;112(31):E4206-15. doi: 10.1073/pnas.1505173112. Epub 2015 Jul 20. Proc Natl Acad Sci U S A. 2015. PMID: 26195753 Free PMC article.
-
An intrinsically disordered nascent protein interacts with specific regions of the ribosomal surface near the exit tunnel.Commun Biol. 2021 Oct 29;4(1):1236. doi: 10.1038/s42003-021-02752-4. Commun Biol. 2021. PMID: 34716402 Free PMC article.
-
Cytosolic protein quality control machinery: Interactions of Hsp70 with a network of co-chaperones and substrates.Exp Biol Med (Maywood). 2021 Jun;246(12):1419-1434. doi: 10.1177/1535370221999812. Epub 2021 Mar 17. Exp Biol Med (Maywood). 2021. PMID: 33730888 Free PMC article. Review.
-
A proteome-wide map of chaperone-assisted protein refolding in a cytosol-like milieu.Proc Natl Acad Sci U S A. 2022 Nov 29;119(48):e2210536119. doi: 10.1073/pnas.2210536119. Epub 2022 Nov 23. Proc Natl Acad Sci U S A. 2022. PMID: 36417429 Free PMC article.
-
Protein folding in vitro and in the cell: From a solitary journey to a team effort.Biophys Chem. 2022 Aug;287:106821. doi: 10.1016/j.bpc.2022.106821. Epub 2022 Apr 29. Biophys Chem. 2022. PMID: 35667131 Free PMC article. Review.
References
-
- Mayer MP, Brehmer D, Gässler CS, Bukau B. Hsp70 chaperone machines. Adv Protein Chem. 2001;59:1–12. - PubMed
-
- Hartl FU, Hayer-Hartl M. Molecular chaperones in the cytosol: from nascent chain to folded protein. Science. 2002;295:1852–1858. - PubMed
-
- Frydman J. Folding of newly translated proteins in vivo: the role of molecular chaperones. Annu Rev Biochem. 2001;70:603–647. - PubMed
-
- Mayer MP, Rudiger S, Bukau B. Molecular basis for interactions of the DnaK chaperone with substrates. Biol Chem. 2000;381:877–885. - PubMed
Publication types
MeSH terms
Substances
Grants and funding
LinkOut - more resources
Full Text Sources
Molecular Biology Databases

