. 2012;10(4):e1001315.
doi: 10.1371/journal.pbio.1001315. Epub 2012 Apr 24.

Sialyllactose in viral membrane gangliosides is a novel molecular recognition pattern for mature dendritic cell capture of HIV-1

Affiliations

Sialyllactose in viral membrane gangliosides is a novel molecular recognition pattern for mature dendritic cell capture of HIV-1

Nuria Izquierdo-Useros et al. PLoS Biol. 2012.

Abstract

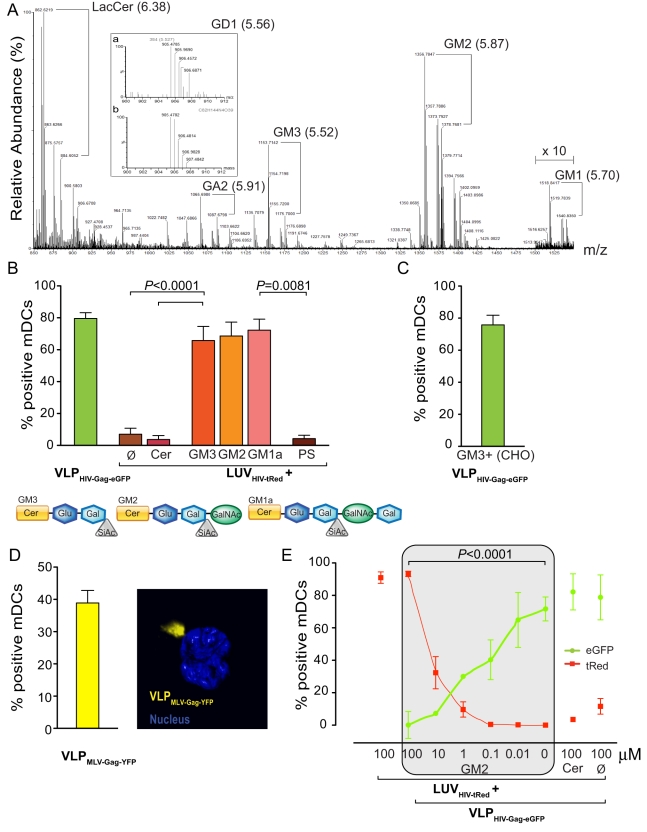
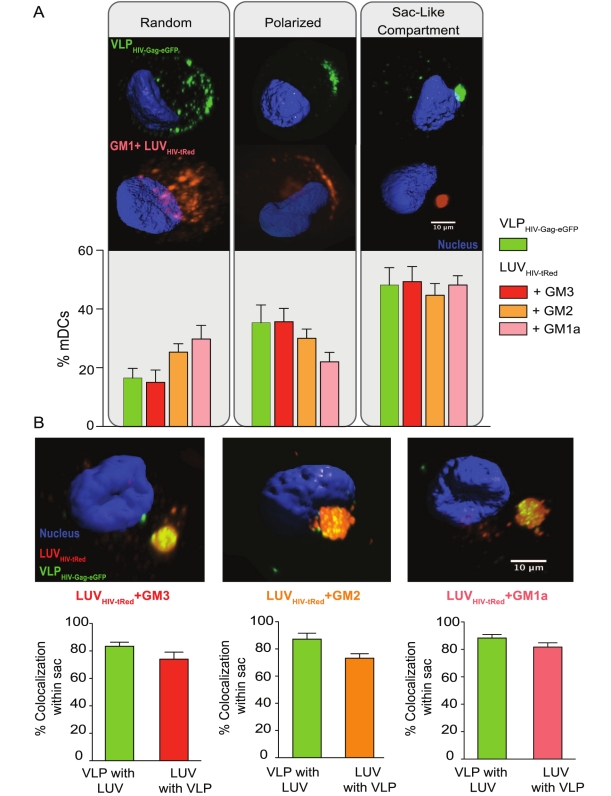
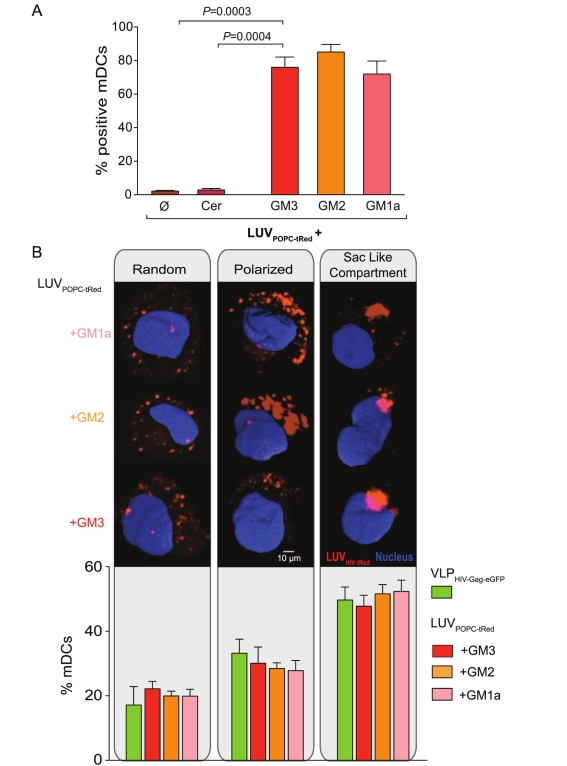
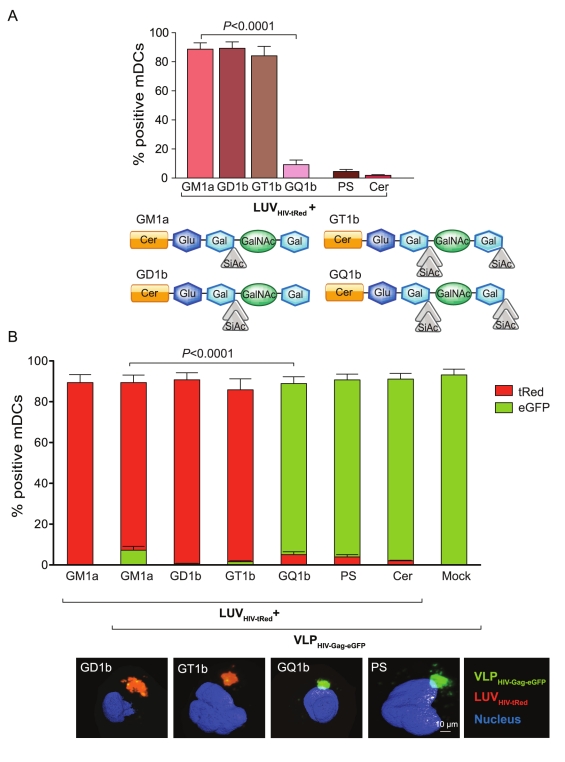
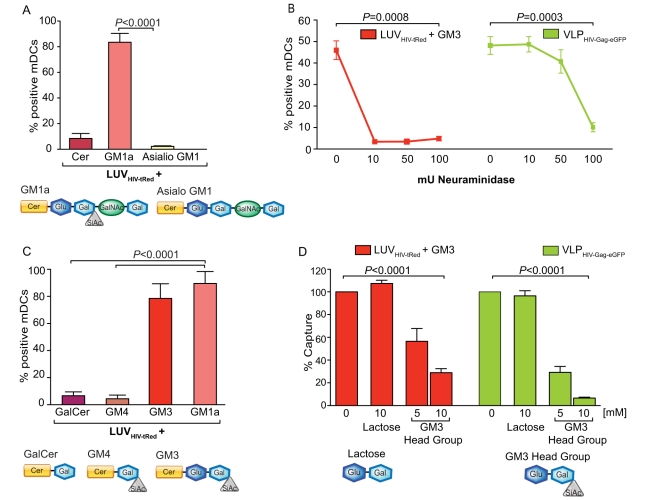
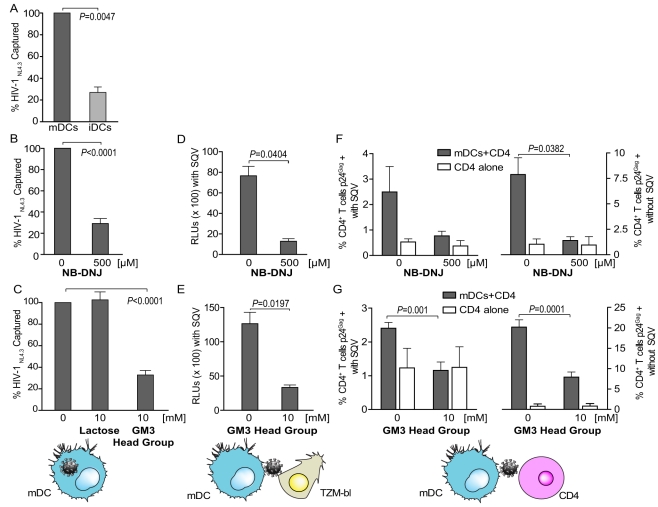
HIV-1 is internalized into mature dendritic cells (mDCs) via an as yet undefined mechanism with subsequent transfer of stored, infectious virus to CD4+ T lymphocytes. Thus, HIV-1 subverts a DC antigen capture mechanism to promote viral spread. Here, we show that gangliosides in the HIV-1 membrane are the key molecules for mDC uptake. HIV-1 virus-like particles and liposomes mimicking the HIV-1 lipid composition were shown to use a common internalization pathway and the same trafficking route within mDCs. Hence, these results demonstrate that gangliosides can act as viral attachment factors, in addition to their well known function as cellular receptors for certain viruses. Furthermore, the sialyllactose molecule present in specific gangliosides was identified as the determinant moiety for mDC HIV-1 uptake. Thus, sialyllactose represents a novel molecular recognition pattern for mDC capture, and may be crucial both for antigen presentation leading to immunity against pathogens and for succumbing to subversion by HIV-1.


Conflict of interest statement

A patent application based on this work has been filed (EP11382392.6, 2011). The authors have declared that no other competing interests exist.

Figures

Figure 1
Figure 1. Gangliosides are required for viral capture mediated by mDC.
(A) Ganglioside detection in lipid extracts from MT4 derived HIVNL4-3.Partial mass spectrum (from 850 to 1550 amu) corresponding to the 5.3- and 6.5-min range of a UPLC/TOF ESI (+) chromatogram representative of three different viral isolations. The selected time range corresponds to the N-hexadecanoyl (N-C16) species. The N-C22, N-C24, and N-C24:1 species were also observed. For each compound of interest identified, the exact mass of its [M+H]+ and [M+Na]+ ions are indicated. The retention time of each compound is given within parenthesis next to its abbreviation. Inset: exact mass ion cluster obtained at 5.56 min for GD1 (a) and exact mass ion cluster corresponding to the formula C82H144N4O39 with a charge state of 2 (b). X 10 indicates a ten-fold magnification between 1,500 and 1,550 amu. GA2, N-acetyl-D-galactosaminyl-D-galactosyl-D-glucosylceramide; LacCer, D-galactosyl-D-glucosylceramide (lactosylceramide). (B) Comparative mDC capture of VLPHIV-Gag-eGFP produced in HEK-293T and distinct fluorescent LUVHIV-tRed containing Cer, GM3, GM2, GM1a, or PS. A total of 2×10⁵ DCs were pulsed for 4 h at 37°C with 100 µM of LUV or 75 ng of VLPHIV-Gag-eGFP Gag in 0.2 ml, washed with PBS, and assessed by FACS to obtain the percentage of tRed or eGFP-positive cells. Data show mean values and standard error of the mean (SEM) from five independent experiments including cells from at least six donors. mDCs capture significantly higher amounts of GM3-containing LUVHIV-tRed than Cer or Ø LUVHIV-tRed (p<0.0001, paired t test). mDCs capture significantly higher amounts of GM1a-containing LUVHIV-tRed than negatively charged PS-LUVHIV-tRed (p = 0.0081, paired t test). Schematic representation of the gangliosides used in the LUVs for these experiments is shown underneath. (C) Capture of VLPHIV-Gag-eGFP produced in CHO cell line, which is only able to synthesize gangliosides up to GM3. A total of 2×10⁵ mDCs were incubated for 4 h at 37°C with 75 ng of sucrose-pelleted VLPHIV-Gag-eGFP Gag, washed and analyzed by FACS to determine the percentage of eGFP-positive cells. Data show mean values and SEM from one representative experiment out of two including cells from three donors. (D) mDC capture of VLPMLV-Gag-YFP. Graph shows mDCs pulsed for 4 h at 37°C with VLPMLV-Gag-YFP, washed with PBS and assayed by FACS to obtain the percentage of YFP-positive cells. Data show mean values and SEM of cells from three donors. Left image depicts confocal microscopy analysis of pulsed cells, showing a 3-D reconstruction of the x-y sections collected throughout the whole mDC z volume every 0.1 µm. Isosurface representation of DAPI-stained nucleus is depicted, computing the maximum intensity fluorescence of the sac-like compartment surface within a 3-D volumetric x-y-z data field, where VLPMLV-Gag-YFP accumulate within a compartment analogous to that observed for HIV-1. (E) Capture competition between 75 ng of VLPHIV-Gag-eGFP Gag and decreasing amounts (µM) of GM2-containing LUVHIV-tRed. As controls, we used the maximum concentration of LUVHIV-tRed (100 µM) with or without Cer. Cells were incubated for 4 h at 37°C, washed and analyzed by FACS to establish the percentage of eGFP- and tRed-positive cells. Data show mean values and SEM from three independent experiments including cells from at least four donors. mDCs capture fewer VLPHIV-Gag-eGFP in the presence of higher amounts of GM2-containing LUVHIV-tRed (p<0.0001, paired t test).
Figure 2
Figure 2. Ganglioside-containing LUVHIV-tRed traffic to the same compartment as VLP HIV-Gag-eGFP in mDCs.
(A) (Top) Fluorescence images showing the different patterns of 75 ng of VLPHIV-Gag-eGFP Gag and 100 µM of GM1a-containing LUVHIV-tRed capture mediated by mDCs: random binding, polarized accumulation, and formation of a sac-like compartment. 3-D reconstructions of the x-y sections were performed collecting images every 0.1 µm throughout the whole mDC volume. Isosurface representation of DAPI-stained nucleus is shown, computing the maximum intensity of the green and red fluorescence within a 3-D volumetric x-y-z data field. (Bottom) Percentage of mDCs with distinct capture patterns after 4 h of independent challenging with VLPHIV-Gag-eGFP or ganglioside-containing LUVHIV-tRed. Cells were classified using confocal microscopy displaying particles as indicated in the top images. Data show mean values and SEM of more than 100 cells from five different donors. (B) Confocal microscopy analysis of mDCs previously pulsed with 100 µM of GM1a, GM2, and GM3 containing LUVHIV-tRed and then exposed to 75 ng of VLPHIV-Gag-eGFP Gag. (Top images) 3-D reconstructions of the x-y sections collected throughout the whole mDC z volume every 0.1 µm. Isosurface representation of DAPI stained nucleus is shown, computing the maximum intensity fluorescence of the sac-like compartment surface within a 3-D volumetric x-y-z data field, where VLPHIV-Gag-eGFP and ganglioside-containing LUVHIV-tRed are accumulated within the same compartment. (Bottom graphs) Quantification of the percentage of VLPHIV-Gag-eGFP co-localizing with ganglioside-containing LUVHIV-tRed and vice versa, obtained analyzing at least ten compartments from mDCs of three different donors. The mean and standard deviation of the thresholded correlation coefficients of Manders and Pearson (obtained considering all the images) were 0.752±0.03 and 0.44±0.11, respectively, indicating co-localization.
Figure 3
Figure 3. Capture of ganglioside-containing LUVHIV-tRed by mDCs is independent of membrane liquid order.
(A) Comparative mDC capture of LUVPOPC-tRed containing or not Cer, GM3, GM2, or GM1a. A total of 2×10⁵ DCs were pulsed for 4 h at 37°C with 100 µM of LUVs, washed with PBS, and assessed by FACS to obtain the percentage of tRed-positive cells. Data show mean values and SEM from three independent experiments including cells from at least six donors. mDCs capture significantly higher amounts of GM3-containing LUVPOPC-tRed than Cer or LUVPOPC-tRed (p-values on the graph, paired t test). (B) (Top images) Fluorescence images showing the different phases of ganglioside-containing LUVPOPC-tRed capture mediated by mDCs: random binding, polarized accumulation, and formation of a sac-like compartment. 3-D reconstructions of the x-y sections were performed collecting images every 0.1 µm throughout the whole mDC z volume. Isosurface representation of DAPI stained nucleus is shown, computing the maximum intensity of the green and red fluorescence within a 3-D volumetric x-y-z data field. (Bottom graph) Percentages of mDCs with distinct liposome capture pattern after 4 h of ganglioside-containing LUVPOPC-tRed challenging. Cells were classified using confocal microscopy displaying particles as indicated in the top images. Data show mean values and SEM of more than 100 mDCs from three different donors.
Figure 4
Figure 4. Ganglioside complexity determines mDC capture.
(A) Comparative mDC capture of distinct LUVHIV-tRed containing GM1a, polysialogangliosides such as GD1b, GT1b, and GQ1b; PS and Cer. A total of 2×10⁵ DCs were pulsed for 4 h at 37°C with 100 µM of LUVs, washed with PBS, and assessed by FACS to obtain the percentage of tRed-positive cells. Data show mean values and SEM from two independent experiments including cells from six donors. mDCs capture significantly higher amounts of GM1a-containing LUVHIV-tRed than GQ1b-containing LUVHIV-tRed (p<0.0001, paired t test). Schematic of the gangliosides in the LUVs employed for these experiments is shown underneath. (B) Capture competition between mDCs pulsed with 75 ng of VLPHIV-Gag-eGFP Gag and 100 µM of different polysialogangliosides LUVHIV-tRed. Cells were incubated for 4 h at 37°C, washed, and analyzed by FACS to determine the percentage of eGFP- and tRed-positive cells. Data show mean values and SEM from two independent experiments including cells from six donors. mDCs capture fewer VLPHIV-Gag-eGFP in the presence of GM1a-containing LUVHIV-tRed than in the presence of the same concentration of GQ1b containing LUVHIV-tRed (p<0.0001, paired t test). Representative fluorescence images from mDCs exposed to the indicated LUVHIV-tRed in these experiments are shown in the bottom of the graph. Isosurface representation of DAPI stained nucleus is shown, computing the maximum intensity of the green and red fluorescence within a 3-D volumetric x-y-z data field.
Figure 5
Figure 5. Identification of the molecular recognition domain present in gangliosides essential for mDC capture.
(A) Comparative mDC capture of distinct LUVHIV-tRed containing Cer, GM1a, or GM1 lacking sialic acid (Asialo GM1). A total of 2×10⁵ DCs were pulsed for 4 h at 37°C with 100 µM of LUVs, washed with PBS, and assessed by FACS to obtain the percentage of tRed-positive cells. Data show mean values and SEM from three independent experiments, including cells from nine donors. mDCs capture significantly higher amounts of GM1a-containing LUVHIV-tRed than Asialo GM1-containing LUVHIV-tRed (p<0.0001, paired t test). Schematic of the gangliosides present in the LUVs of these experiments is shown underneath. (B) Comparative mDC capture of GM3-containing LUVHIV-tRed and VLPHIV-Gag-eGFP treated or not with neuraminidase to remove sialic acid. A total of 2×10⁵ DCs were pulsed for 2 h at 37°C with 25 µM of LUVs and 75 ng of VLPHIV-Gag-eGFP Gag treated or not with C. perfringens neuraminidase for 12 h, washed with PBS, and assessed by FACS to obtain the percentage of tRed- and eGFP-positive cells. Data show mean values and SEM from two independent experiments including cells from five donors. mDCs capture significantly higher amounts of untreated particles than neuraminidase-treated particles (p-values on the graph, paired t test). (C) Comparative mDC capture of distinct LUVHIV-tRed containing GalCer, GM4, GM3, or GM1a. A total of 2×10⁵ DCs were pulsed for 4 h at 37°C with 100 µM of LUVs, washed, and assessed by FACS to obtain the percentage of tRed-positive cells. Data show mean values and SEM from three independent experiments including cells from nine donors. mDCs capture significantly higher amounts of GM1a-containing LUVHIV-tRed than GalCer or GM4-containing LUVHIV-tRed (p<0.0001, paired t test). Schematic of the molecules present in the LUVs for these experiments is shown underneath. (D) Graph representing the relative capture of GM3-containing LUVHIV-tRed and VLPHIV-Gag-eGFP by mDCs that had been pre-incubated with 10 mM of soluble lactose or with 5–10 mM of GM3 carbohydrate polar head group, normalized to the level of LUV/VLP capture by mock-treated mDCs (set at 100%). mDCs captured fewer particles upon treatment with GM3 polar head group (p-values on the graph, paired t test). Data show mean values and SEM from three independent experiments including cells from at least nine donors.
Figure 6
Figure 6. Sialyllactose in membrane gangliosides is required for mDC uptake and trans-infection of HIV-1.
(A) Relative capture of HIVNL4-3 produced in primary cells by mDCs and iDCs. DCs were pulsed for 4 h at 37°C with equal amounts of a HIVNL4-3 produced in stimulated PBMCs, extensively washed, and then assayed for cell-associated p24Gag content by ELISA. Results are expressed as the percentage of HIVNL4-3 captured by iDCs relative to mDCs, normalized to 100% of viral capture. Viral uptake was increased in mDCs compared to iDCs (p = 0.0047, one sample t test). Data show mean values and SEM from two independent experiments including cells from three donors. (B) Relative capture of HIVNL4-3 produced in CD4+ T cells that had been treated or not with the glycosphingolipid inhibitor NB-DNJ. mDCs were pulsed for 4 h at 37°C with equal amounts of HIVNL4-3 generated in NB-DNJ-treated or mock-treated CD4+ T cells and then assayed for p24Gag content. mDCs captured less HIVNL4-3 generated in NB-DNJ-treated CD4+ T cells (p<0.0001, one sample t test). Data show mean values and SEM from two independent experiments including cells from six donors. (C) Competition of HIVNL4-3 capture by mDCs in the presence of the GM3 head group. mDCs were either pre-incubated with 10 mM lactose, 10 mM GM3 head group, or mock treated, and were then pulsed for 4 h at 37°C with equal amounts of HIVNL4-3 generated in CD4+ T cells. Virus uptake was assayed by ELISA for p24Gag. HIVNL4-3 capture was strongly reduced upon pre-treatment with the GM3 head group, but not lactose (p<0.0001, one sample t test). Data show mean values and SEM from two independent experiments including cells from six donors. (D) Transmission of HIVNL4-3 produced in NB-DNJ or mock-treated CD4+ T cells to the TZM-bl target cell line, which expresses the luciferase gene under control of the HIV LTR. mDCs treated as described in (B) but pulsed with an equal MOI of 0.1 were extensively washed and co-cultured with TZM-bl cells in the presence of saquinavir (to prevent second round infection) for 48 h before measurement of luciferase activity. Trans-infection was less efficient for HIVNL4-3 generated in NB-DNJ-treated compared to untreated CD4+ T cells (p = 0.0404, paired t test). Data show mean values and SEM from one experiment including cells from three donors. (E) Competition of trans-infection of HIVNL4-3 in the presence of the GM3 head group. mDCs treated as described in (C) but pulsed with an MOI of 0.1 were extensively washed and co-cultured with TZM-bl in the presence of saquinavir for 48 h before measurement of luciferase activity. Trans-infection was significantly reduced by the GM3 head group (p = 0.0197, paired t test). Data show mean values and SEM from two independent experiments including cells from six donors. (F) Trans-infection of activated primary CD4+ T cells by co-culture with mDCs pulsed with HIVNL4-3 produced in NB-DNJ or mock- treated CD4+ T cells. mDCs were pulsed with HIVNL4-3 at an equivalent MOI of 0.1 as described in (B). Unwashed pulsed mDCs were subsequently co-cultured with primary CD4+ T cells for 48 h before measuring the intracellular p24Gag content in the lymphocyte gate (CD2+ and CD11c cells) by FACS (filled bars). Equivalent amounts of cell-free HIVNL4-3 were used as a control (open bars). Experiments were done in the presence (left panel) or absence (right panel) of saquinavir to distinguish net trans-infection from re-infection events, respectively. mDCs transferred less HIVNL4-3 generated in NB-DNJ-treated CD4+ T cells (p = 0.0382, paired t test). Data show mean values and SEM from one representative experiment including cells from three donors. (G) Trans-infection of activated primary CD4+ T cells by co-culture with mDCs pulsed with HIVNL4-3 in the presence or absence of the GM3 head group. mDCs were pulsed with HIVNL4-3 at an equivalent MOI of 0.1 as described in (C). Unwashed pulsed mDCs were subsequently co-cultured with primary CD4+ T cells for 48 h before measuring the intracellular p24Gag content in the lymphocyte gate (CD2+ and CD11c cells) by FACS, as detailed in (F). mDCs transferred less HIVNL4-3 upon treatment with the GM3 head group (p-values on the graph, paired t test). Data show mean values and SEM from two independent experiments including cells from six donors.

Comment in

Similar articles

Cited by

References

    1. Banchereau J, Steinman R. M. Dendritic cells and the control of immunity. Nature. 1998;392:245–252. - PubMed
    1. Steinman R. M, Banchereau J. Taking dendritic cells into medicine. Nature. 2007;449:419–426. - PubMed
    1. Mellman I, Steinman R. M. Dendritic cells specialized and regulated antigen processing machines. Cell. 2001;106:255–258. - PubMed
    1. Villadangos J. A, Schnorrer P. Intrinsic and cooperative antigen-presenting functions of dendritic-cell subsets in vivo. Nat Rev Immunol. 2007;7:543–555. - PubMed
    1. Probst H. C, van den Broek M. Priming of CTLs by lymphocytic choriomeningitis virus depends on dendritic cells. J Immunol. 2005;174:3920–3924. - PubMed

Publication types