. 2012 Apr 25;484(7395):473-8.
doi: 10.1038/nature11039.

Multiple dynamic representations in the motor cortex during sensorimotor learning

Affiliations

Multiple dynamic representations in the motor cortex during sensorimotor learning

D Huber et al. Nature. .

Abstract

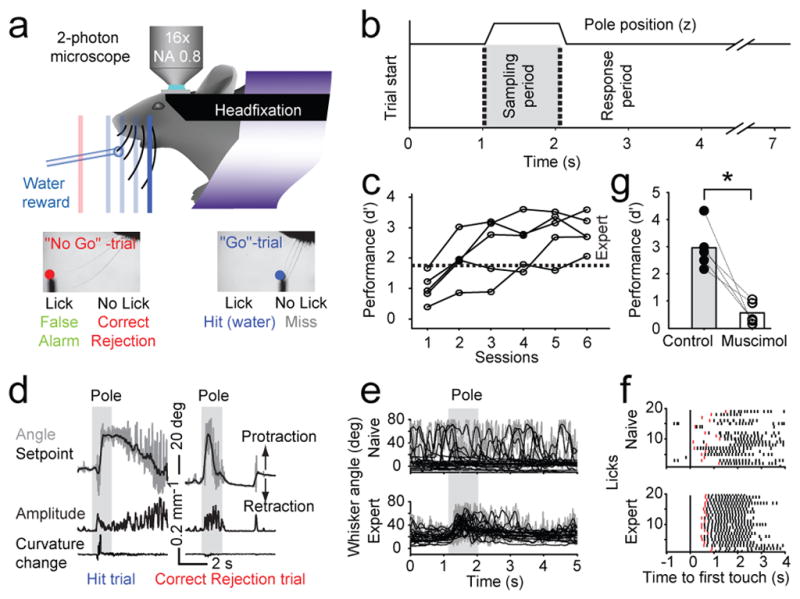
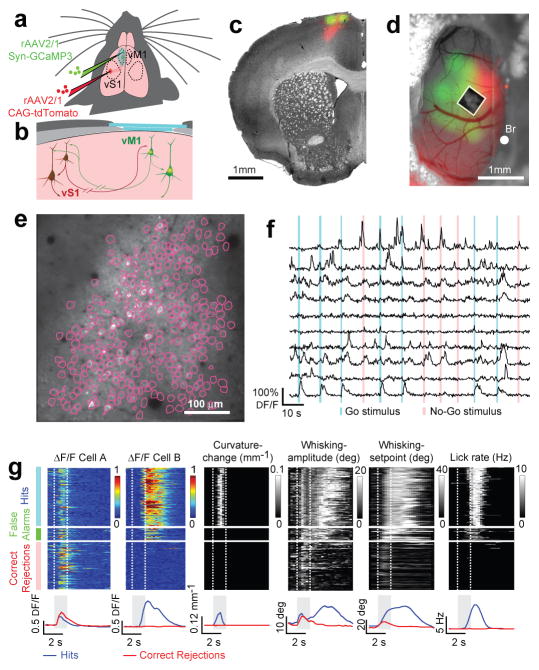
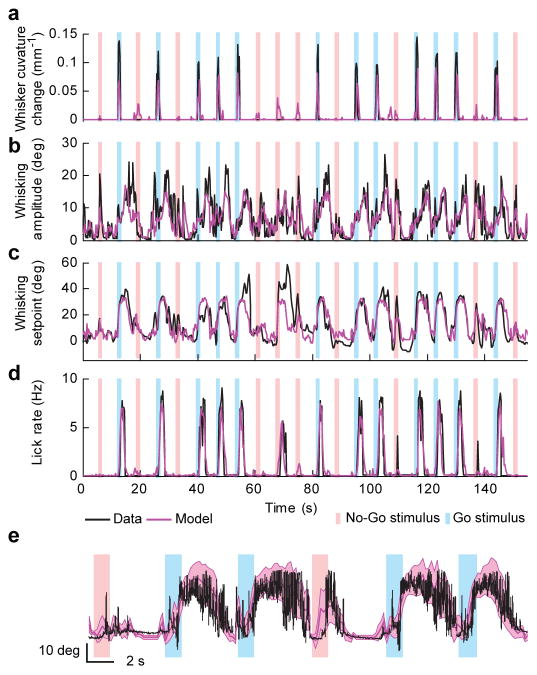
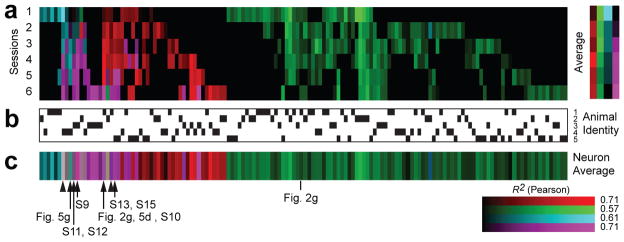
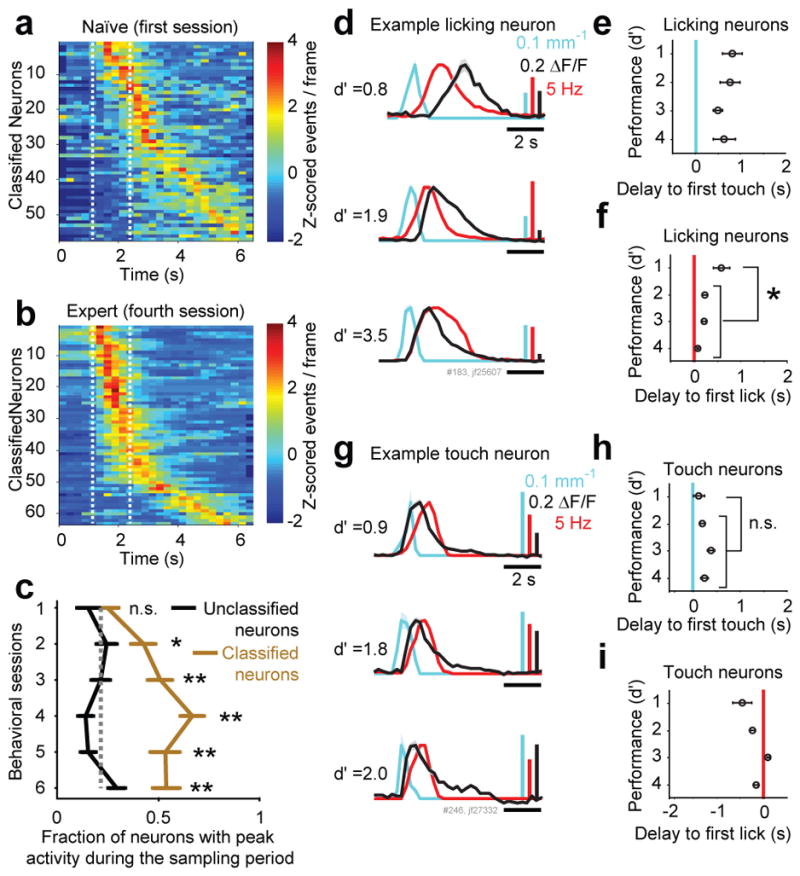
The mechanisms linking sensation and action during learning are poorly understood. Layer 2/3 neurons in the motor cortex might participate in sensorimotor integration and learning; they receive input from sensory cortex and excite deep layer neurons, which control movement. Here we imaged activity in the same set of layer 2/3 neurons in the motor cortex over weeks, while mice learned to detect objects with their whiskers and report detection with licking. Spatially intermingled neurons represented sensory (touch) and motor behaviours (whisker movements and licking). With learning, the population-level representation of task-related licking strengthened. In trained mice, population-level representations were redundant and stable, despite dynamism of single-neuron representations. The activity of a subpopulation of neurons was consistent with touch driving licking behaviour. Our results suggest that ensembles of motor cortex neurons couple sensory input to multiple, related motor programs during learning.


Conflict of interest statement

Competing financial interests

The authors declare no competing financial interests

Figures

Figure 1
Figure 1. Learning a whisker-based object detection task under the microscope
a) A head-fixed mouse under a two-photon microscope. Whisker movements were tracked with high-speed videography. A metal pole was presented either within reach of the whiskers (one of several target locations, blue, ‘Go’-trial) or out-of-reach (red, ‘No Go’-trial). b) The pole was within reach in the sampling period. Onset of pole movement produced an auditory cue (vertical dotted lines). Answer licks were scored in the answer period. c) Learning curves. The sensitivity index d′ measures behavioral performance (d′ = 0, chance performance; d′ = 1.75, expert level, gray, approximately 80 % correct trials). d) Whisker movement and forces. Top, trial showing whisker angle (gray) and setpoint (black). Middle, whisking amplitude (Methods). Bottom, change in whisker curvature, which is proportional to force acting on the follicle. Left, Hit trial; right. Correct Rejection trial. e) Learning-related changes in whisking. Whisker angle (measured at the base of the whisker, gray) and setpoint (low-pass filtered angle, black) for 20 consecutive Correct Rejection trials in the first (top; d′ = 0.83, first session) fifth session (bottom; d′ = 3.52). f) Learning-related changes in licking. Licks (ticks; answer licks in red), aligned to first touch, for 20 consecutive Hit trials in naïve (top; d′ = 0.83) and the same animal in the fourth session (bottom; d′ = 3.59). g) Behavioral performance drops after inactivation of vM1 (n = 5 mice, control, solid circles; muscimol, open circles).
Figure 2
Figure 2. Imaging population activity across trials
a) Injection sites for GCaMP3 virus in vibrissal motor cortex (vM1) and tdTomato virus in somatosensory cortex (vS1). b) Glass imaging window (light blue). Bone, light grey; dental cement, dark grey. L2/3 neurons in vM1 receive strong input from vS1 and excite deep layer neurons in vM1. c–d) GCaMP3 (green) and tdTomato (red) fluorescence image overlaid on a bright-field image (gray). c) Coronal section. d) Imaging window. Box, field of view in e. Bregma, Br. e) L2/3 neurons expressing GCaMP3 (depth, 210 um). Individual regions (individual neurons) are outlined in purple. f) Example fluorescence traces (ten neurons, twelve trials). Vertical bars, sampling period (Go trials, blue; No Go trials, red). g) Example neurons (cell A & B) across one session (329 trials; expert, d′ = 3.13) and simultaneously recorded behaviors. Consecutive Hit, False Alarm, and Correct Rejection trials are arrayed from top to bottom (Misses were rare in this session). Fluorescence intensity was normalized. Curvature changes due to touch occur only during the sampling period in Hit trials, because otherwise the pole was out of reach. Whisking occurred in all trials. Licking occurred in Hit and False Alarm trials. Lower panel: session averages for correct trial types (Hits, blue; Correct Rejections, red).
Figure 3
Figure 3. Population decoding of behavioral features
a–d) Time series of behavioral features (black; down-sampled to the imaging rate, 4 Hz) and a model based on the activity of all active neurons in one session (magenta) (same session as in Fig. 2g). Vertical bars, sampling period (Go trials, blue; No Go trials, red). a) Whisker curvature change. b) Whisking amplitude. c) Whisking setpoint. d) Lick rate. Shuffling trial labels dropped the quality of the fit for all behavioral features (Ri2 > Ri, shuffled2, p < 0.001 for all sessions and animals except for three sessions in which coding of touch was weak; whisking amplitude, mean z-score, 73; whisking setpoint, mean z-score, 28; licking, mean z-score, 23; touch, mean z-score, 10; 1000 shuffles; see Supplementary Fig. 14l,m for an explanation of z-scores). e) Overlay of whisking at full bandwidth (black) and the model (thick magenta line, whisking setpoint; magenta band, whisking setpoint ± whisking amplitude).
Figure 4
Figure 4. Single neuron representations across learning
a) Dynamics of classified neurons over learning (cyan, touch; magenta, mixed; red, licking; green, whisking). The intensity of the color indicates the correlation (R2) between data and the model (Methods). Session 1, naïve mice; session 6, expert mice. b) Animal identity. Each vertical column corresponds to one animal. Black ticks indicate the animal corresponding to the classified cell. c) Classification of individual neurons averaged across sessions. Arrow heads, neurons with object location-dependent activity. Tagged neurons, data shown in other figures.
Figure 5
Figure 5. Plasticity in task-related neuronal dynamics
a–b) Trial averages of all classified neurons, ordered by the timing of their peak activity. a) Naïve mice (first session). b) Highly performing mice (fourth session). c) Fraction of neurons with peak activity during the sampling period of classified (brown) and unclassified neurons (black) as a function of learning (mean ± sem, n = 5 mice). The gray dotted line indicates the expected fraction of neurons if the timing of peak activity was uniformly distributed across the trial (* P<0.05; ** P<0.005; χ2 test for each session). d–i) Temporal parameters of licking and touch neurons, as a function of task performance. Performance (d′) was binned as follows: 1: <1.75, 2: 1.75–2.5, 3: 2.5–3.5, 4: >3.5. d) PSTHs of touch (change in whisker curvature, cyan), lick rate (red) and fluorescent traces of a representative licking neuron (black) in a naïve (top trace), during learning (middle trace) and an expert animal (bottom trace). e) Delay from first contact to activity onset in licking neurons (12 neurons, decoding licking for at least 4 days; mean ± sem). f) Delay from first lick to activity onset in licking neurons. The delay shortened after learning (* P<0.005, Wilcoxon rank sum test). g) PSTHs of touch (whisker curvature change, cyan), lick rate (red) and calcium transients (black) of a representative touch neuron in a naïve (top trace), during learning (middle trace) and an expert animal (bottom trace). h) Delay from first contact to activity onset in touch neurons (12 neurons, from 4 animals) i) Delay from first lick to activity onset in touch neurons.
Figure 6
Figure 6. Stability in population decoding
a) Decoding of behavioral features as a function of behavioral performance. Individual animals correspond to different symbols; lines are linear fits. Top, whisker curvature; middle, whisking setpoint; bottom, lick rate. Whisking amplitude was similar to whisking setpoint and is not shown. b) Matrix of correlation coefficients for all mice, binned and averaged by behavioral performance (d′). Each point corresponds to a model derived at one value of d′ applied to a session with another value of d′. The points corresponding to models and data from the same session (diagonal) were excluded. c) Stability of population decoding (representation) of behavioral features (change in R2) as a function of change in behavioral performance. Points derived as in b. Changes in the representation of licking were more predictive with respect to changes in behavioral performance than whisking or touch: Licking, R2 = 0.39, F1,148 = 94; p < 10−17; whisking setpoint, R2 = 0.21; F1,148 = 40; p < 10−17; touch R2 = 0.07; F1,148 = 11; p < 0.001; licking vs setpoint: p < 0.001; Ansari-Bradley test.

Similar articles

Cited by

References

    1. Scott SH. Inconvenient truths about neural processing in primary motor cortex. The Journal of physiology. 2008;586:1217–1224. doi: 10.1113/jphysiol.2007.146068. - DOI - PMC - PubMed
    1. Wolpert DM, Diedrichsen J, Flanagan JR. Principles of sensorimotor learning. Nature reviews. Neuroscience. 2011;12:739–751. doi: 10.1038/nrn3112. - DOI - PubMed
    1. Wise SP, Moody SL, Blomstrom KJ, Mitz AR. Changes in motor cortical activity during visuomotor adaptation. Experimental brain research. Experimentelle Hirnforschung. Experimentation cerebrale. 1998;121:285–299. - PubMed
    1. Rokni U, Richardson AG, Bizzi E, Seung HS. Motor learning with unstable neural representations. Neuron. 2007;54:653–666. doi: 10.1016/j.neuron.2007.04.030. - DOI - PubMed
    1. Komiyama T, et al. Learning-related fine-scale specificity imaged in motor cortex circuits of behaving mice. Nature. 2010;464:1182–1186. - PubMed

Publication types