

Neuroimaging markers of human immunodeficiency virus infection in South Africa
- PMID: 22528474
- PMCID: PMC3715135
- DOI: 10.1007/s13365-012-0090-5
Neuroimaging markers of human immunodeficiency virus infection in South Africa
Abstract
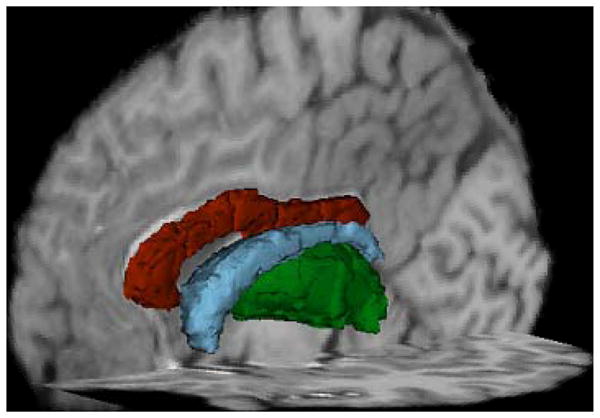
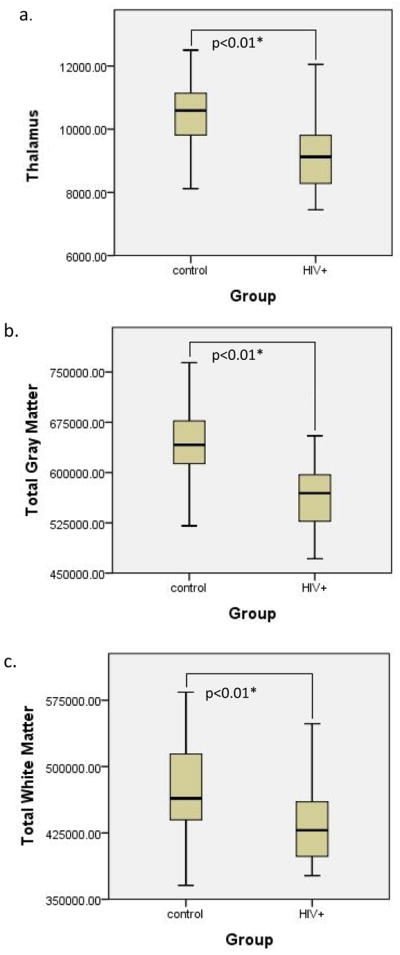
Previous studies have reported cognitive deficits among HIV-positive individuals infected with clade C virus. However, no study has examined whether individuals predominately infected with clade C virus exhibit brain atrophy relative to healthy controls. This study examined volumetric differences between 28 HIV+ individuals and 23 HIV- controls from South Africa. Volumetric measures were obtained from six regions of interest -- caudate, thalamus, corpus callosum, total cortex, total gray matter, and total white matter. HIV+ participants had significantly lower volumes in the total white matter (p<0.01), thalamus (p<0.01) and total gray matter (inclusive of cortical and subcortical regions, p<0.01). This study is the first to provide evidence of brain atrophy among HIV+ individuals in South Africa, where HIV clade C predominates. Additional research that integrates neuroimaging, comprehensive neuropsychological testing, genetic variance in clade-specific proteins, and the impact of treatment with Antiretrovirals (ARV) are necessary to understand the development of HIV-related neurocognitive disorders in South Africa.
Figures
Similar articles
-
HIV clades B and C are associated with reduced brain volumetrics.J Neurovirol. 2013 Oct;19(5):479-87. doi: 10.1007/s13365-013-0202-x. J Neurovirol. 2013. PMID: 24078556 Free PMC article.
-
Association between brain volumes and HAND in cART-naïve HIV+ individuals from Thailand.J Neurovirol. 2015 Apr;21(2):105-12. doi: 10.1007/s13365-014-0309-8. Epub 2015 Jan 21. J Neurovirol. 2015. PMID: 25604494 Free PMC article.
-
Regional areas and widths of the midsagittal corpus callosum among HIV-infected patients on stable antiretroviral therapies.J Neurovirol. 2011 Aug;17(4):368-79. doi: 10.1007/s13365-011-0033-6. Epub 2011 May 10. J Neurovirol. 2011. PMID: 21556960 Free PMC article.
-
Dementia and neurocognitive disorders due to HIV-1 infection.Semin Neurol. 2007 Feb;27(1):86-92. doi: 10.1055/s-2006-956759. Semin Neurol. 2007. PMID: 17226745 Review.
-
Effect of HIV clade differences on the onset and severity of HIV-associated neurocognitive disorders.J Neurovirol. 2013 Dec;19(6):515-22. doi: 10.1007/s13365-013-0206-6. Epub 2013 Oct 16. J Neurovirol. 2013. PMID: 24129908 Free PMC article. Review.
Cited by
-
Neuroimaging of HIV-associated neurocognitive disorders (HAND).Curr Opin HIV AIDS. 2014 Nov;9(6):545-51. doi: 10.1097/COH.0000000000000112. Curr Opin HIV AIDS. 2014. PMID: 25250553 Free PMC article. Review.
-
Larger Subcortical Gray Matter Structures and Smaller Corpora Callosa at Age 5 Years in HIV Infected Children on Early ART.Front Neuroanat. 2017 Nov 2;11:95. doi: 10.3389/fnana.2017.00095. eCollection 2017. Front Neuroanat. 2017. PMID: 29163068 Free PMC article.
-
Cerebral alterations in West African HIV and non-HIV adults aged ≥50: An MRI study.Int J Infect Dis. 2021 Feb;103:457-463. doi: 10.1016/j.ijid.2020.12.016. Epub 2020 Dec 10. Int J Infect Dis. 2021. PMID: 33310027 Free PMC article.
-
The role of Pannexin-1 channels and extracellular ATP in the pathogenesis of the human immunodeficiency virus.Purinergic Signal. 2021 Dec;17(4):563-576. doi: 10.1007/s11302-021-09817-3. Epub 2021 Sep 20. Purinergic Signal. 2021. PMID: 34542793 Free PMC article. Review.
-
Neuroimaging abnormalities in clade C HIV are independent of Tat genetic diversity.J Neurovirol. 2017 Apr;23(2):319-328. doi: 10.1007/s13365-016-0503-y. Epub 2016 Dec 2. J Neurovirol. 2017. PMID: 27913960 Free PMC article.
References
-
- Amin J, Kaye M, Skidmore S, Pillay D, Cooper DA, Dore GJ. HIV and hepatitis C coinfection within the CAESAR study. HIV Medicine. 2004;5:174–179. - PubMed
-
- Elovaara I, Poutiainen E, Raininko R, Valanne L, Virta A, Valle SL, Lahdevirta J, Iivanainen M. Mild brain atrophy in early HIV infection: the lack of association with cognitive deficits and HIV-specific intrathecal immune response. J Neurol Sci. 1990;99:121–36. - PubMed
Publication types
MeSH terms
Substances
Grants and funding
LinkOut - more resources
Full Text Sources
Medical
