The interaction properties of the human Rab GTPase family--comparative analysis reveals determinants of molecular binding selectivity
- PMID: 22523562
- PMCID: PMC3327705
- DOI: 10.1371/journal.pone.0034870
The interaction properties of the human Rab GTPase family--comparative analysis reveals determinants of molecular binding selectivity
Abstract
Background: Rab GTPases constitute the largest subfamily of the Ras protein superfamily. Rab proteins regulate organelle biogenesis and transport, and display distinct binding preferences for effector and activator proteins, many of which have not been elucidated yet. The underlying molecular recognition motifs, binding partner preferences and selectivities are not well understood.
Methodology/principal findings: Comparative analysis of the amino acid sequences and the three-dimensional electrostatic and hydrophobic molecular interaction fields of 62 human Rab proteins revealed a wide range of binding properties with large differences between some Rab proteins. This analysis assists the functional annotation of Rab proteins 12, 14, 26, 37 and 41 and provided an explanation for the shared function of Rab3 and 27. Rab7a and 7b have very different electrostatic potentials, indicating that they may bind to different effector proteins and thus, exert different functions. The subfamily V Rab GTPases which are associated with endosome differ subtly in the interaction properties of their switch regions, and this may explain exchange factor specificity and exchange kinetics.
Conclusions/significance: We have analysed conservation of sequence and of molecular interaction fields to cluster and annotate the human Rab proteins. The analysis of three dimensional molecular interaction fields provides detailed insight that is not available from a sequence-based approach alone. Based on our results, we predict novel functions for some Rab proteins and provide insights into their divergent functions and the determinants of their binding partner selectivity.
Conflict of interest statement
Figures


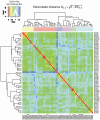
 , where SIab is the pairwise Hodgkin similarity index (Hodgkin and Richards, 1987) calculated for the complete protein skin. The electrostatic potential distance clustering suggests six subclusters with a different composition from the sequence-based analysis.


Similar articles
-
Determinants of the broad recognition of exocytic Rab GTPases by Mss4.Biochemistry. 2001 Dec 25;40(51):15699-706. doi: 10.1021/bi0116792. Biochemistry. 2001. PMID: 11747446
-
The mammalian Rab family of small GTPases: definition of family and subfamily sequence motifs suggests a mechanism for functional specificity in the Ras superfamily.J Mol Biol. 2000 Aug 25;301(4):1077-87. doi: 10.1006/jmbi.2000.4010. J Mol Biol. 2000. PMID: 10966806
-
Structure, exchange determinants, and family-wide rab specificity of the tandem helical bundle and Vps9 domains of Rabex-5.Cell. 2004 Sep 3;118(5):607-17. doi: 10.1016/j.cell.2004.08.009. Cell. 2004. PMID: 15339665
-
Chapter 5: rab proteins and their interaction partners.Int Rev Cell Mol Biol. 2009;274:235-74. doi: 10.1016/S1937-6448(08)02005-4. Int Rev Cell Mol Biol. 2009. PMID: 19349039 Review.
-
Rab GTPase localization and Rab cascades in Golgi transport.Biochem Soc Trans. 2012 Dec 1;40(6):1373-7. doi: 10.1042/BST20120168. Biochem Soc Trans. 2012. PMID: 23176483 Free PMC article. Review.
Cited by
-
Recognition and stabilization of geranylgeranylated human Rab5 by the GDP Dissociation Inhibitor (GDI).Small GTPases. 2019 May;10(3):227-242. doi: 10.1080/21541248.2017.1371268. Epub 2017 Oct 25. Small GTPases. 2019. PMID: 29065764 Free PMC article.
-
Conformational plasticity of JRAB/MICAL-L2 provides "law and order" in collective cell migration.Mol Biol Cell. 2016 Oct 15;27(20):3095-3108. doi: 10.1091/mbc.E16-05-0332. Epub 2016 Aug 31. Mol Biol Cell. 2016. PMID: 27582384 Free PMC article.
-
Using kernelized partial canonical correlation analysis to study directly coupled side chains and allostery in small G proteins.Bioinformatics. 2015 Jun 15;31(12):i124-32. doi: 10.1093/bioinformatics/btv241. Bioinformatics. 2015. PMID: 26072474 Free PMC article.
-
Recombinant expression and preliminary characterization of Peptidyl-prolyl cis/trans-isomerase Rrd1 from Saccharomyces cerevisiae.PLoS One. 2023 Jun 13;18(6):e0282749. doi: 10.1371/journal.pone.0282749. eCollection 2023. PLoS One. 2023. PMID: 37310980 Free PMC article.
-
Early stages of functional diversification in the Rab GTPase gene family revealed by genomic and localization studies in Paramecium species.Mol Biol Cell. 2017 Apr 15;28(8):1101-1110. doi: 10.1091/mbc.E16-06-0361. Epub 2017 Mar 1. Mol Biol Cell. 2017. PMID: 28251922 Free PMC article.
References
-
- Chavrier P, Parton RG, Hauri HP, Simons K, Zerial M. Localization of Low-Molecular-Weight GTP Binding-Proteins to Exoctytic and Endocytic Compartments. Cell. 1990;62:317–329. - PubMed
-
- Schwartz SL, Cao C, Pylypenko O, Rak A, Wandinger-Ness A. Rab GTPases at a glance. Journal of Cell Science. 2007;120:3905–3910. - PubMed
-
- Zerial M, McBride H. Rab proteins as membrane organizers. Nature Reviews Molecular Cell Biology. 2001;2:107–117. - PubMed
-
- Bock JB, Matern HT, Peden AA, Scheller RH. A genomic perspective on membrane compartment organization. Nature. 2001;409:839–841. - PubMed
Publication types
MeSH terms
Substances
LinkOut - more resources
Full Text Sources
Other Literature Sources

