. 2012 May 16;31(10):2296-308.
doi: 10.1038/emboj.2012.105. Epub 2012 Apr 20.

Mmi1 RNA surveillance machinery directs RNAi complex RITS to specific meiotic genes in fission yeast

Affiliations

Mmi1 RNA surveillance machinery directs RNAi complex RITS to specific meiotic genes in fission yeast

Edwige Hiriart et al. EMBO J. .

Abstract

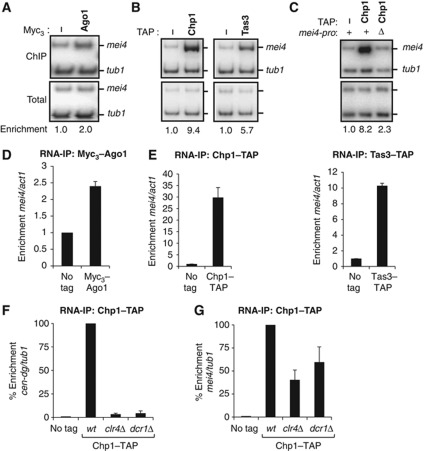
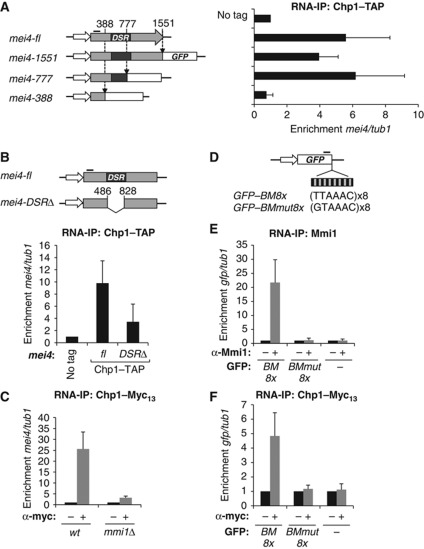
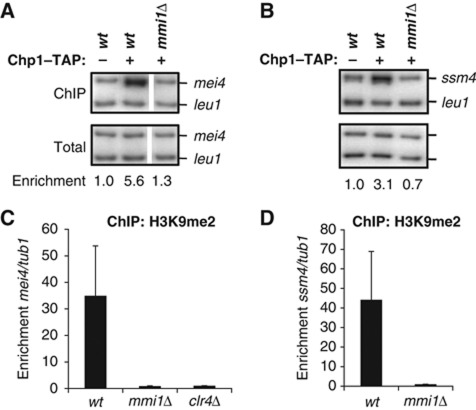
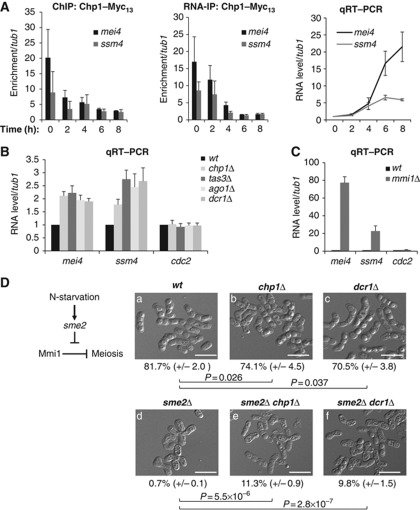
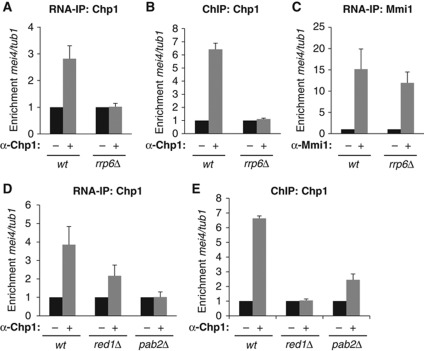
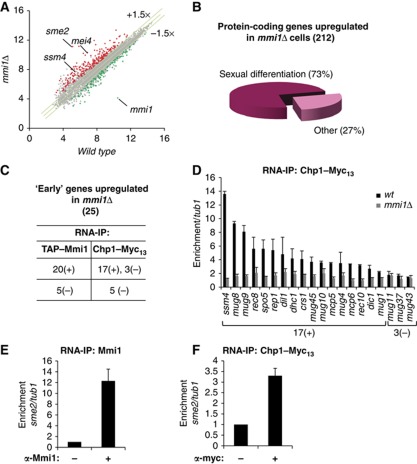
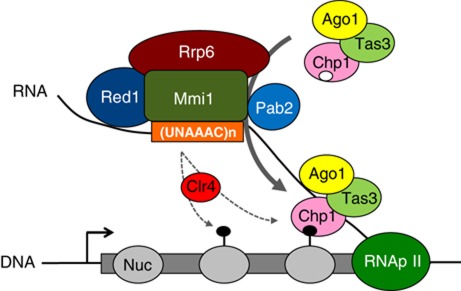
RNA interference (RNAi) silences gene expression by acting both at the transcriptional and post-transcriptional levels in a broad range of eukaryotes. In the fission yeast Schizosaccharomyces pombe the RNA-Induced Transcriptional Silencing (RITS) RNAi complex mediates heterochromatin formation at non-coding and repetitive DNA. However, the targeting and role of RITS at other genomic regions, including protein-coding genes, remain unknown. Here we show that RITS localizes to specific meiotic genes and mRNAs. Remarkably, RITS is guided to these meiotic targets by the RNA-binding protein Mmi1 and its associated RNA surveillance machinery that together degrade selective meiotic mRNAs during vegetative growth. Upon sexual differentiation, RITS localization to the meiotic genes and mRNAs is lost. Large-scale identification of Mmi1 RNA targets reveals that RITS subunit Chp1 associates with the vast majority of them. In addition, loss of RNAi affects the effective repression of sexual differentiation mediated by the Mmi1 RNA surveillance machinery. These findings uncover a new mechanism for recruiting RNAi to specific meiotic genes and suggest that RNAi participates in the control of sexual differentiation in fission yeast.


Conflict of interest statement

The authors declare that they have no conflict of interest.

Figures

Figure 1
Figure 1
Localization of RITS to mei4 gene and mRNA. (A, B) ChIP analyses of Myc3-Ago1, Chp1-TAP and Tas3-TAP association with the mei4 gene, relative to the control gene tubulin (tub1). α32 P-labelled PCR fragments were run on polyacrylamide gel and quantified with a phosphorimager. (C) ChIP analysis of Chp1-TAP association with mei4 wild type gene or mei4 deleted of its promoter (deletion of nucleotides -307 to -7), relative to tub1. Panels A, B and C show each time the result of one ChIP experiment. The average enrichments obtained from three independent experiments are shown in Supplementary Figures 1A, B and C. (D, E) RNA-IP analyses of Myc3-Ago1, Chp1-TAP and Tas3-TAP association with mei4 mRNA, relative to actin (act1) control mRNA, normalized to an untagged strain. Quantification was done using qRT–PCR. (F, G) RNA-IP analysis of Chp1-TAP association with pericentromeric RNA (cen-dg) or mei4 mRNA, relative to tub1 mRNA. Enrichments are expressed as a percentage of the relative enrichment monitored in wild type. Error bars represent standard deviations (s.d.) from at least three independent biological replicates. Figure source data can be found with the Supplementary data.
Figure 2
Figure 2
RITS association with mei4 mRNA requires mei4 DSR sequence and the RNA-binding protein Mmi1. (A) Diagram (left panel and not to scale) depicting the three insertion sites made in mei4 gene to gradually delete mei4 open reading frame (at nucleotides +1551, +777 and +388, relative to mei4 start codon). Deletions were made by inserting a GFP cassette (schematized by the white box) composed of the GFP coding sequence fused to the terminator of adh1 followed by the kanamycin resistance gene. RNA-IP analysis (right panel) of Chp1-TAP binding to mei4 mRNA full-length (mei4-fl) or to the three truncated mei4 mRNAs (mei4-1551, mei4-777 and mei4-388), relative to tub1 mRNA. Chp1-TAP binding was checked at a region located in the 5′ part of mei4 mRNA, represented by a thick black line on the diagram. Black box highlights the position of the determinant of selective removal (DSR) sequence. (B) Diagram (upper panel and not to scale) of mei4 gene deleted of just its DSR sequence with no foreign DNA sequence left and RNA-IP experiment (lower panel) of Chp1-TAP binding to the 5′ part of mei4-DSRΔ mRNA, as in (A). Relative enrichments were measured by qRT–PCR and compared to an untagged control strain. (C) RNA-IP analysis of Chp1-Myc13 binding to mei4 mRNA in wild type and mmi1Δ, relative to tub1. (D) Diagram of the GFP coding sequence fused to 8 repeats of the binding motif (BM) TTAAAC (GFP-BM8x) or to 8 repeats of the mutated binding motif GTAAAC (GFP-BMmut8x). The thick black line highlights the region of the GFP mRNA where the association with Mmi1 and Chp1 was examined. (E, F) RNA-IP analyses of Mmi1 and Chp1-Myc13 association with GFP mRNA or the recombinant GFP mRNAs described in (D), relative to tub1. All error bars represent s.d. from at least three independent replicates.
Figure 3
Figure 3
RITS associates with mei4 and ssm4 genes in a Mmi1-dependent fashion. (A, B) ChIP analysis of Chp1-TAP binding to mei4 and ssm4 chromatin in wild type or mmi1Δ, relative to the control gene leu1. Panel A and B are the results of one experiment. The average enrichments obtained from three independent experiments are shown in Supplementary Figure 4A and B. Note that in panel A the white separation between the second and third lane is to indicate that the lanes come from the same gel but were non-adjacent and that the gel was cropped to juxtapose them. (C) ChIP analysis of H3K9me2 deposition on mei4 gene in wild type, mmi1Δ and clr4Δ, relative to tub1. (D) ChIP analysis of H3K9me2 deposition on ssm4 gene in mmi1Δ, relative to tub1. Error bars represent s.d. from three independent experiments. Figure source data can be found with the Supplementary data.
Figure 4
Figure 4
Effective Mmi1-mediated silencing activity is impaired in RNAi deficient cells. (A) Time course analysis from diploid cells induced to undergo sexual differentiation by nitrogen starvation. ChIP (left panel) and RNA-IP (middle panel) analyses of Chp1-Myc13 association with respectively the chromatin and mRNAs of mei4 and ssm4, relative to tub1. qRT–PCR analysis (right panel) of mei4 and ssm4 RNA levels, relative to tub1 RNA, during the time course analysis. (B) qRT–PCR analysis of mei4, ssm4 and cdc2 RNA levels in chp1Δ, tas3Δ, ago1Δ or dcr1Δ, relative to tub1 RNA and normalized to the wild type. (C) qRT–PCR analysis of mei4, ssm4 and cdc2 RNA levels in mmi1Δ, relative to tub1 RNA and normalized to the respective RNA levels in wild type. All error bars represent s.d. from three independent biological replicates. (D) Diagram depicting the sme2-dependent inhibition of Mmi1 upon sexual differentiation (left panel). Representative images of cells counted after sexual differentiation induction to measure sporulation frequency of the wild type (a), chp1Δ (b), dcr1Δ (c) and sme2Δ (d) single mutants, and sme2Δ chp1Δ (e) and sme2Δ dcr1Δ (f) double mutants (right panel). Sporulation frequency was determined by counting ascospores and the total number of cells under a microscope. An ascospore was counted as the product of two cells. Sporulation frequency expressed in percentage is represented as a mean (±s.d.) calculated from three independent biological replicates. P values were calculated using the Student’s t-test. White scale bars=10 μm. Figure source data can be found with the Supplementary data.
Figure 5
Figure 5
Mmi1 RNA surveillance factors, Rrp6, Red1 and Pab2 show distinct contributions to RITS association with mei4. (A) RNA-IP analysis of Chp1 association with mei4 mRNA in wild type or rrp6Δ, relative to tub1 mRNA. Relative enrichment was normalized to IP done without antibody. (B) ChIP analysis of Chp1 association with mei4 gene in wild type or rrp6Δ, relative to tub1. (C) RNA-IP analysis of Mmi1 binding to mei4 mRNA in wild type or rrp6Δ, relative to tub1 mRNA. (D) RNA-IP analysis of Chp1 association with mei4 mRNA in wild type, red1Δ or pab2Δ, relative to tub1 mRNA. (E) ChIP analysis of Chp1 association with mei4 gene in wild type, red1Δ or pab2Δ, relative to tub1. All error bars represent s.d. from three independent experiments.
Figure 6
Figure 6
Transcriptome of mmi1Δ cells and large-scale identification of RNAs bound by Mmi1 and Chp1. (A) Scatter plot of S. pombe genome-wide gene expression measured from hybridization signals of RNAs isolated from mmi1Δ cells (Y axis) and from wild type cells (X axis). Red and green dots represent genes up and down regulated, respectively. Grey dots represent genes with no change in their RNA level in mmi1Δ compared to wild type and mei4-828 cells. Each hybridization signal is an average of two independent biological replicates and is plotted using a log2 scale. Note that the mmi1Δ cells used for the transcriptome analysis also contain the mei4-828 mutation (further described in the experimental procedure section). Transcriptome of mei4-828 cells is highly similar to wild type cells as shown in Supplementary Figure 6A. (B) Pie chart representing the distribution of the protein-coding genes upregulated in mmi1Δ cells according to their expression during sexual differentiation (Mata et al, 2002). (C) Table summarizing the RNA-IP analyses of TAP-Mmi1 and Chp1-Myc13 association with 25 mRNAs specific of the ‘early’ phase of sexual differentiation and accumulating in mmi1Δ, relative to tub1 mRNA control. An RNA was considered significantly associated with Mmi1 or Chp1 when enriched at least two fold after RNA-IP. Enriched and non-enriched mRNAs are classified as (+) and (−), respectively. (D) RNA-IP analysis of Chp1-Myc13 association with Mmi1 mRNA targets in wild type or mmi1Δ, relative to tub1. 17(+) and 3(−) denote respectively RNAs that are and are not significantly enriched in Chp1-Myc13 RNA-IP in (D). (E, F) RNA-IP analyses of Mmi1 or Chp1-Myc13 association with sme2 RNA, relative to tub1. Error bars represent s.d. from at least three independent experiments.
Figure 7
Figure 7
Model for the Mmi1 RNA surveillance-driven recruitment of RITS to meiotic (m)RNAs and genes. Mmi1 binds to a target meiotic RNA through the recognition of its hexameric RNA-binding motif (UNAAAC) and recruits the RNA surveillance machinery. Rrp6, Pab2 and Red1 proteins are factors important for Mmi1 RNA surveillance machinery. Recruitment of this machinery enables or stabilizes the binding of RITS to the target RNA. RITS can bind both meiotic RNAs and their corresponding genes. Pab2 protein assists mostly RITS binding to the RNA, whereas Red1 would favour the recruitment of RITS to chromatin by mediating Clr4-dependent H3K9 methylation. These two mechanisms working side-by-side would further reinforce the recruitment of RITS to chromatin and mRNAs. Furthermore, a selective regulation of only one of the two mechanisms may be a mean to modulate RITS binding to the RNA versus chromatin of the target gene. Nuc: nucleosome; Black lollipop: H3K9me repressive histone mark; White circle on Chp1 depicts its chromodomain; RNApII: RNA polymerase II; (UNAAAC)n: cluster of Mmi1 hexameric binding motifs.

Comment in

Similar articles

Cited by

References

    1. Aravin AA, Sachidanandam R, Bourc'his D, Schaefer C, Pezic D, Toth KF, Bestor T, Hannon GJ (2008) A piRNA pathway primed by individual transposons is linked to de novo DNA methylation in mice. Mol Cell 31: 785–799 - PMC - PubMed
    1. Bahler J, Wu JQ, Longtine MS, Shah NG, McKenzie A 3rd, Steever AB, Wach A, Philippsen P, Pringle JR (1998) Heterologous modules for efficient and versatile PCR-based gene targeting in Schizosaccharomyces pombe. Yeast 14: 943–951 - PubMed
    1. Bayne EH, White SA, Kagansky A, Bijos DA, Sanchez-Pulido L, Hoe KL, Kim DU, Park HO, Ponting CP, Rappsilber J, Allshire RC (2010) Stc1: a critical link between RNAi and chromatin modification required for heterochromatin integrity. Cell 140: 666–677 - PMC - PubMed
    1. Bitton DA, Grallert A, Scutt PJ, Yates T, Li Y, Bradford JR, Hey Y, Pepper SD, Hagan IM, Miller CJ (2011) Programmed fluctuations in sense/antisense transcript ratios drive sexual differentiation in S. pombe. Mol Syst Biol 7: 559. - PMC - PubMed
    1. Bourc'his D, Voinnet O (2010) A small-RNA perspective on gametogenesis, fertilization, and early zygotic development. Science 330: 6004617–622 - PubMed

Publication types

MeSH terms

Substances