. 2012;8(4):e1002621.
doi: 10.1371/journal.pgen.1002621. Epub 2012 Apr 12.

Type 2 diabetes risk alleles demonstrate extreme directional differentiation among human populations, compared to other diseases

Affiliations

Type 2 diabetes risk alleles demonstrate extreme directional differentiation among human populations, compared to other diseases

Rong Chen et al. PLoS Genet. 2012.

Abstract

Many disease-susceptible SNPs exhibit significant disparity in ancestral and derived allele frequencies across worldwide populations. While previous studies have examined population differentiation of alleles at specific SNPs, global ethnic patterns of ensembles of disease risk alleles across human diseases are unexamined. To examine these patterns, we manually curated ethnic disease association data from 5,065 papers on human genetic studies representing 1,495 diseases, recording the precise risk alleles and their measured population frequencies and estimated effect sizes. We systematically compared the population frequencies of cross-ethnic risk alleles for each disease across 1,397 individuals from 11 HapMap populations, 1,064 individuals from 53 HGDP populations, and 49 individuals with whole-genome sequences from 10 populations. Type 2 diabetes (T2D) demonstrated extreme directional differentiation of risk allele frequencies across human populations, compared with null distributions of European-frequency matched control genomic alleles and risk alleles for other diseases. Most T2D risk alleles share a consistent pattern of decreasing frequencies along human migration into East Asia. Furthermore, we show that these patterns contribute to disparities in predicted genetic risk across 1,397 HapMap individuals, T2D genetic risk being consistently higher for individuals in the African populations and lower in the Asian populations, irrespective of the ethnicity considered in the initial discovery of risk alleles. We observed a similar pattern in the distribution of T2D Genetic Risk Scores, which are associated with an increased risk of developing diabetes in the Diabetes Prevention Program cohort, for the same individuals. This disparity may be attributable to the promotion of energy storage and usage appropriate to environments and inconsistent energy intake. Our results indicate that the differential frequencies of T2D risk alleles may contribute to the observed disparity in T2D incidence rates across ethnic populations.


Conflict of interest statement

The authors have declared that no competing interests exist.

Figures
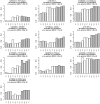
Figure 1
Figure 1. T2D risk alleles share a similar pattern of frequencies across 11 HapMap populations with higher frequencies in African and lower frequencies in Asian populations.
Risk-allele frequencies (RAF) were shown as heights of bars across the 11 HapMap populations at 10 independent cross-ethnic T2D SNPs, which had been replicated to associate with T2D in five or more diverse populations. Two cross-ethnic T2D SNPs including rs5219 and rs2074196 were not shown due to the lack of RAF data. Most T2D SNPs share the same pattern of population differentiation with higher RAFs in the African (ASW, MKK, LWK, YRI, colored in grey and listed on the right) and lower RAFs in the Asian populations (JPT, CHB, CHD, shaded and listed on the left), compared to the RAFs in the European populations. For each risk allele, a p value was calculated as the percentage of genomic alleles with matched frequencies in the European populations that show both higher African RAF and lower Asian RAF than the observed. For example, only 8.96×10⁻⁵ matched genomic alleles show both higher frequencies in the African populations and lower frequencies in the Asian populations than the observed frequencies of rs11196205. All T2D risk alleles except for two alleles in CDKAL1 show statistically significantly larger population differentiation than European frequency-matched genome alleles (p<0.05). The (anc) in the sub-title indicates that the risk allele is the ancestral allele according to mammalian sequence data, retrieved from dbSNP.
Figure 2
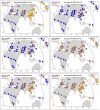
Figure 2. HGDP data show that T2D risk allele frequencies decrease from Sub-Saharan Africa through Europe to East Asia.
The frequencies of six cross-ethnic T2D risk alleles were shown as dark blue wedges across the 53 populations, calculated from 1,064 individuals in the Human Genome Diversity Panel (HGDP) . All T2D risk alleles decrease frequencies gradually from Sub-Saharan Africa through Europe to East Asia. A similar pattern was observed in the remaining five T2D risk alleles in Figure S2. The central map shows the Sub-Saharan Africa region on the lower left and the East Asia region on the right. The smaller map shows Mexico and South America regions. Similar to Figure 1, p values were calculated as the percentage of genomic alleles with matched frequencies in the European populations that show both higher frequencies in the Sub-Saharan Africa regions and lower frequencies in the East Asia regions than the observed RAF. All T2D SNPs except for two in CDKAL1 show statistically significantly larger population differentiation than the frequency-matched genomic alleles (p<0.05). The (anc) in the sub-title indicates that the risk allele is the ancestral allele according to mammalian sequence data, retrieved from dbSNP.
Figure 3
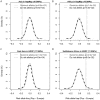
Figure 3. An ensemble of T2D risk alleles demonstrates significant directional differentiation of frequencies among human populations, compared to genomic control alleles and risk alleles for other diseases.
Eleven independent cross-ethnic T2D risk alleles were combined as an ensemble to calculate the average increased frequencies in the populations in Asia (A) and Africa (B) from HapMap, and the East Asia (C) and Sub-Saharan Africa (D) from HGDP, compared with the frequencies in the European populations. The average increased RAFs of T2D risk alleles are shown as dotted vertical lines, and compared against the null distributions of average increased RAFs of 11 alleles randomly drawn from genomic alleles (solid black curve) and disease-susceptible risk alleles (dashed grey curve) that share the same allele frequencies with T2D risk alleles in the European populations. Two-side p values were calculated by comparing dotted vertical lines against the null distributions of frequency-matched control genomic alleles and risk alleles of other diseases. SNPs used in each figure were summarized in Table S4.
Figure 4
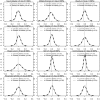
Figure 4. Differential risk allele frequencies in the East Asian populations for 12 common diseases, compared with the frequencies in the European.
We identified 12 common diseases with five or more independent cross-ethnic risk alleles from Varimed. Similar with Figure 3, we plotted the average increased RAFs in the East Asia regions in the HGDP for each of 12 diseases, against the null distributions of frequency-matched control genomic alleles and risk alleles for other diseases. We ordered these 12 diseases by the increased RAF for a direct comparison. T2D was the only disease showing significantly lower RAFs in the East Asian populations. Two-side p values were calculated by comparing dotted vertical lines against the null distributions of frequency-matched control genomic alleles and risk alleles of other diseases. SNPs used in each figure were summarized in Table S4.
Figure 5
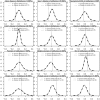
Figure 5. Differential risk allele frequencies in the Sub-Saharan African populations for 12 common diseases, compared with the frequencies in the European.
Similar with Figure 4, we plotted the average increased RAFs in the Sub-Saharan Africa regions in the HGDP for each of 12 diseases, against the null distributions of frequency-matched control genomic alleles and risk alleles for other diseases. We ordered these 12 diseases by the increased RAF for a direct comparison. T2D shows significantly increased RAFs in the Sub-Saharan African populations, followed by prostate cancer. Two-side p values were calculated by comparing dotted vertical lines against the null distributions of frequency-matched control genomic alleles and risk alleles of other diseases. SNPs used in each figure were summarized in Table S4.
Figure 6
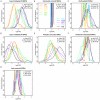
Figure 6. Seven diseases show significantly differential genetic risks across 11 HapMap populations, compared to frequency-matched control genomic genotypes.
The density plots were drawn for the histograms of log(PGR) values with different colors and line styles representing each of 11 different HapMap3 populations. PGR represents Predicted Genetic Risk (PGR) with higher risk on the right. Seven diseases showed significantly differential PGR across populations, including type 2 diabetes (A), colorectal cancer (B), cleft palate (C), type 1 diabetes (D), prostate cancer (E), Parkinson's disease (F), and lung cancer (G). p_Afr shows the likelihood of observing lager log(PGR, African)-log(PGR, Other) values after randomly replacing disease genotypes with global frequency-matched genomic genotypes. For example, an average value of log(PGR) is 0.648 in African populations and −0.224 in other populations for T2D. After randomly replacing T2D genotypes with control genomic genotypes, there is only 4.7×10⁻³ chance finding an average value of log(PGR, African)-log(PGR, Other) larger than 0.872. Similarly, p_Asi and p_Eur represent the likelihoods of observing more extreme values of log(PGR, Asian)-log(PGR, Other) and log(PGR, European)-log(PGR, others) using randomly selected genomic genotypes, respectively. All p values were calculated as two-sided p values. SNPs used in each figure are summarized in Table S4.
Figure 7
Figure 7. A consistent pattern of T2D PGR using SNPs and LRs from ethnic-specific studies.
The density plots were drawn for the histograms of log(PGR) values across 11 HapMap3 population groups using T2D SNPs and likelihood ratios (LRs) from previous studies specifically on each of the following ethnicities: Caucasian (A), African (B), Chinese (C), Japanese (D), and Indian Asian (E). Eleven HapMap3 population groups are plotted with solid or dashed lines with different colors. PGR presents Predicted Genetic Risk with higher risk on the right. A consistent pattern was observed with the highest PGR in the African populations (LWK, YRI, ASW, MKK) and the lowest PGR in the Asian populations (JPT, CHD, CHB) regardless which ethnic-specific T2D SNPs and LRs were used. p_Asi, p_Eur, and p_Afr represent the likelihoods of observing more extreme values of log(PGR, Asian)-log(PGR, Other), log(PGR, European)-log(PGR, others), and log(PGR, African)-log(PGR, Other) using randomly selected control genomic genotypes, respectively. All p values were calculated as two-sided p values. SNPs used in each figure are summarized in Table S4.
Figure 8
Figure 8. Distribution of T2D Genetic Risk Scores in 1,397 HapMap3 individuals.
A high T2D Genetic Risk Score (GRS) had been previously shown to significantly associate with increased risk of developing diabetes in participants from Diabetes Prevention Program . We calculated the GRS scores for 1,397 individuals using 20 SNPs measured in the HapMap and plotted the distribution of GRS across 11 HapMap populations. The distribution of GRS is very similar with that of PGR in Figure 6A. p_Asi, p_Eur, and p_Afr represent the likelihoods of observing more extreme values of log(GRS, Asian)-log(GRS, Other), log(GRS, European)-log(GRS, others), and log(GRS, African)-log(GRS, Other) using randomly selected control genomic genotypes, respectively. All p values were calculated as two-sided p values. GRS SNPs were summarized in Table S4.
Figure 9
Figure 9. Comparison of PGR distributions between whole-genome sequencing and genotyping technologies.
The ethnic distributions of log(PGR) of T2D and Melanoma were calculated for 49 individuals sequenced with over 55× coverage by Complete Genomics and 1,397 HapMap3 individuals genotyped on Illumina 1M and Affymetrix 6.0 arrays. Similar differential T2D genetic risks were observed between two technologies, while differential melanoma genetic risk was only observed from whole genome sequencing. SNPs used in each figure were summarized in Table S4.

Similar articles

Cited by

References

    1. van Dieren S, Beulens JW, van der Schouw YT, Grobbee DE, Neal B. The global burden of diabetes and its complications: an emerging pandemic. Eur J Cardiovasc Prev Rehabil. 2010;17(Suppl 1):S3–8. - PubMed
    1. Groop L, Lyssenko V. Genes and type 2 diabetes mellitus. Curr Diab Rep. 2008;8:192–197. - PubMed
    1. Lyssenko V, Jonsson A, Almgren P, Pulizzi N, Isomaa B, et al. Clinical risk factors, DNA variants, and the development of type 2 diabetes. N Engl J Med. 2008;359:2220–2232. - PubMed
    1. Altshuler DM, Gibbs RA, Peltonen L, Dermitzakis E, Schaffner SF, et al. Integrating common and rare genetic variation in diverse human populations. Nature. 2010;467:52–58. - PMC - PubMed
    1. Cann HM, de Toma C, Cazes L, Legrand MF, Morel V, et al. A human genome diversity cell line panel. Science. 2002;296:261–262. - PubMed

Publication types