. 2012 Apr 13;149(2):467-82.
doi: 10.1016/j.cell.2012.01.056.

Dynamic transformations of genome-wide epigenetic marking and transcriptional control establish T cell identity

Affiliations

Dynamic transformations of genome-wide epigenetic marking and transcriptional control establish T cell identity

Jingli A Zhang et al. Cell. .

Abstract

T cell development comprises a stepwise process of commitment from a multipotent precursor. To define molecular mechanisms controlling this progression, we probed five stages spanning the commitment process using RNA-seq and ChIP-seq to track genome-wide shifts in transcription, cohorts of active transcription factor genes, histone modifications at diverse classes of cis-regulatory elements, and binding repertoire of GATA-3 and PU.1, transcription factors with complementary roles in T cell development. The results highlight potential promoter-distal cis-regulatory elements in play and reveal both activation sites and diverse mechanisms of repression that silence genes used in alternative lineages. Histone marking is dynamic and reversible, and though permissive marks anticipate, repressive marks often lag behind changes in transcription. In vivo binding of PU.1 and GATA-3 relative to epigenetic marking reveals distinctive factor-specific rules for recruitment of these crucial transcription factors to different subsets of their potential sites, dependent on dose and developmental context.


Figures

Figure 1
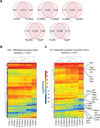
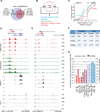
Figure 1. Global comparisons of gene expression among five developmentally related immature T cell populations
A. Pairwise comparisons in gene expression between successive populations and between initial FLDN1 vs. final ThyDP stages: statistically changed genes defined by DEGseq (p < 0.001). B. Hierarchical clustering of expression patterns of all differentially expressed genes (DEGseq positive, ≥2× changed). C. Hierarchical clustering of expression patterns of differentially expressed transcription factors: several key transcription factors indicated.
Figure 2
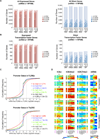
Figure 2. Distinct gene expression patterns are associated with characteristic histone modifications
A. Gene expression and histone modifications at the TSS of 20,861 genes. Expressed (≥ 1RPKM) and silent (<1RPKM) genes defined by RNA-seq. Ac: H3Ac, me2: H3K4me2, me3: H3K27me3. B. Gene expression and histone modifications at the TSS of 1,646 genes encoding DNA-binding proteins or transcription factors. C. Association of promoter-linked histone modifications with developmental change in expression. Genes are grouped based on histone marks of their TSS in the FLDN2a (top) or ThyDN3 (bottom) stages: H3Ac− H3K4me2+ (H3K27me3+ or −) in red, H3Ac+ H3K4me2+ H3K27me3− in blue, H3Ac− H3K4me2− H3K27me3+ in green, and H3Ac− H3K4me2− H3K27me3− in black. Cumulative distributions of genes in each group are plotted vs. expression changes from FLDN1 to FLDN2b (top), and from FLDN2b to ThyDP (bottom). X axis: gene expression change (log2 ratio of RNA-seq levels), downregulated to the left, upregulated to the right (vertical lines: twofold change). Y axis: fraction of group with expression change ≤x axis value. P values from Kolmogorov-Smirnov (K–S) two-sided tests comparing H3Ac−/H3K4me2+ against each of the other three groups are shown. D. Heatmaps correlating TSS histone modifications with various patterns of developmentally regulated gene expression for 9 representative expression clusters (from Fig. S5). Hierarchical clustering within individual clusters used Ward linkage and Euclidean distance. Histone modification data from EBF−/− pre-pro B cells (H3Ac, H3K4me2 and H3K27me3; “PPB”) and CD4+ naïve T cells (H3K27me3 only, “CD4”) are also shown for these genes.
Figure 3
Figure 3. Histone modifications and gene expression profiles of genes characterizing hematopoiesis
Results for 379 “hematopoietic” genes are processed and displayed as in Fig. 2D. Master panel: results for all 379 genes. Panels (a)–(e): zoomed in to indicated cluster regions of master panel to allow individual genes to be seen.
Figure 4
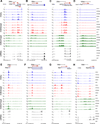
Figure 4. Portraits of key T-lineage and alternative-lineage genes
A – H. Distinct epigenetic marking and gene expression patterns at eight different loci: Bcl11b (A), Cd3e/d/g cluster (B), Gata3 (C), Pax5 (D), Hhex (E), Bcl11a (F), Sfpi1 (G) and Mpzl2 (H), in all five immature T-populations (top to bottom, DN1, DN2a, DN2b, DN3 and DP)(coordinates below each panel). Red arrow: TSS and direction of transcription. H3Ac: blue, H3K4me2: red, H3K27me3: green, RNA-seq: black. Uniform scales are used for histone marks in all panels, and mRNA scales are uniform within each panel (y axis units in RPM).
Figure 5
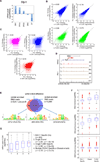
Figure 5. Lineage specific PU.1 DNA binding is associated with lineage specific histone modifications and gene expression
A. Mean RNA-seq level of PU.1 (Sfpi1) at each stage of early T-cell development. B. (Left) Comparisons of PU.1 DNA binding site distributions between FLDN1 and FLDN2a or FLDN2b, with Pearson’s correlation coefficients (r). (Right) Comparisons of PU.1 DNA binding-associated H3K4me2 enrichment between FLDN1 and FLDN2a or FLDN2b. H3K4me2 signal densities were from ±1kb of the summit of a PU.1 bound region. C. Comparisons of PU.1 DNA binding between FLDN1 and E2A−/− pre-pro B, macrophage or mature B cells. D. Lineage-specific PU.1 binding at the Pax5 locus. B-cell specific Pax5 intronic enhancer is bound by PU.1 (black arrow) in E2A−/− pre-pro pre-pro B cells (Heinz et al., 2010) (black track), but not in DN cells (brown tracks). PU.1 ChIP-seq in ThyDP is used as a negative control. For orientation, H3K4me2 pattern in DN1 stage is included (red track). E. Lineage specific and shared PU.1 binding sites between FLDN1 and E2A−/− pre-pro B cells. Lineage specific: ≥4× difference in PU.1 occupancy between populations. Sequence logos show the most highly enriched sequence motif for each occupancy subgroup. Percentages of regions from the three subgroups with ≥1 instance of each motif are given in parentheses beneath each sequence logo (E2A−/− specific/Shared/FLDN1 specific). F. Distribution of the enrichment of specified histone modification over genomic regions within ± 1kb of lineage specific and shared PU.1 binding sites in FLDN1 cells. G. Correlation of mRNA expression levels in FLDN1 with presence of lineage-specific or shared PU.1 sites. Distribution of mRNA value in FLDN1 for subgroups of genes that are linked to either E2A−/− pre-pro B specific, FLDN1 specific, or shared PU.1 binding sites, and genes linked to more than one PU.1 site occupied in FLDN1 cells (Multiple). K-S test compares E2A−/− Specific Only with each of the other three subgroups (n and p values in parentheses).
Figure 6
Figure 6. Functional and stage-dependent PU.1 binding in early T-cell development
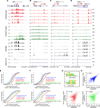
A. Stage specific and non stage-specific (shared) PU.1 binding sites: stage specific binding defined by ≥4× difference in signal densities between FLDN1 and FLDN2b. B. Differential expression of PU.1 binding linked genes. Top: of 13,335 PU.1 binding linked genes in DN cells, the numbers expressed in FLDN1 (blue circle) and FLDN2b cells (red circle) are shown (7,244 stably expressed, 1,045 differentially expressed: ≥2× change). To test whether PU.1 occupancy correlated with positive or negative regulation, all differentially expressed genes were split among 3 subgroups based on changes in PU.1 binding to linked sites (see panel A): genes with FLDN1 specific sites only (Loss of PU.1 binding in FLDN2b, blue), those retaining PU.1 binding at all sites in FLDN2b (red), and genes that rapidly lose PU.1 binding from some sites but not others (Mixed, green). C. Relationship between PU.1 occupancy changes and mRNA expression changes between FLDN2b and FLDN1: cumulative distributions of expression changes for three groups of genes depicted in B. The number of genes in each group and p values (K-S tests for comparisons with “Mixed”) are indicated next to the plots. D, E. Developmentally distinct PU.1 binding patterns at the Tal1 (D) and Il7ra (E) loci in FLDN1, FLDN2a, FLDN2b and E2A−/− pre-pro B cells, compared with H3K4me2, H3K27me3 and mRNA in all five immature T-populations. F. Distribution of PU.1 occupancy relative to TSS sites in expressed and silent genes at individual stages. G. Location of PU.1 sites in potential target genes according to expression pattern. Clusters of genes with different developmental trajectories (Fig. S5) were scored by the number of genes they include with PU.1 binding sites ± 1kb from the TSS (proximal) or further from the TSS (distal). □,◊ (left axis): % of genes in a cluster with proximal (□) or distal (◊) PU.1 binding. Bar graphs (right axis): (number of genes with TSS sites)/(number of genes with distal sites). Colors of bars relate expression pattern of each cluster to endogenous PU.1 expression (most similar: blue, inverse: red). See Figs. 2D, S5, & Table S6.
Figure 7
Figure 7. Developmental plasticity of GATA-3 DNA binding and associated epigenetic marking
A – D. Stage-specific GATA-3 binding (brown) in Lyl1, Ets2-Erg, Itk and Tcfe2a loci of FLDN1, FLDN2b and ThyDP cells, shown with binding associated H3K4me2 (red) and H3K27me3 (green) enrichment and mRNA (black) expression in all five immature T-populations. E. Cumulative distributions of changes in GATA-3 occupancy between FLDN2b and FLDN1 (top) and between ThyDP and FLDN2b (bottom), for genes differentially regulated across the same intervals. GATA-3 binding sites were divided into 4 subgroups, based on linkage to downregulated genes (blue), upregulated genes (red), stably expressed genes (< 2-fold change in expression, green) and silent gene sites (<1RPKM in both stages, black). P values are from K-S tests between stably expressed gene sites and each of the other three subgroups (n= no. of sites). F. Cumulative distributions of changes in H3K4me2 marks associated with GATA-3 binding between FLDN2b and FLDN1 (top) and between ThyDP and FLDN2b (bottom) stages. H3K4me2 signal densities were calculated within −/+1kb of the summit of a given GATA-3 bound region (depicted in Figure 7H). P values calculated as in E. G. Most highly enriched sequence motifs in GATA-3 binding regions (see panel H). The percentages of regions containing ≥1 instance of each motif are indicated beneath each sequence logo, with the expected frequency of the motif in random regions in parentheses. H. Scatter plots depicting the comparisons in GATA-3 binding between FLDN1, FLDN2b and ThyDP. Pearson correlation coefficients are shown for each comparison.

Similar articles

Cited by

References

    1. Barski A, Cuddapah S, Cui K, Roh TY, Schones DE, Wang Z, Wei G, Chepelev I, Zhao K. High-resolution profiling of histone methylations in the human genome. Cell. 2007;129:823–837. - PubMed
    1. David-Fung E-S, Butler R, Buzi G, Yui MA, Diamond RA, Anderson MK, Rowen L, Rothenberg EV. Transcription factor expression dynamics of early T-lymphocyte specification and commitment. Dev. Biol. 2009;325:444–467. - PMC - PubMed
    1. Decker T, Pasca dM, McManus S, Sun Q, Bonifer C, Tagoh H, Busslinger M. Stepwise activation of enhancer and promoter regions of the B cell commitment gene Pax5 in early lymphopoiesis. Immunity. 2009;30:508–520. - PubMed
    1. DeKoter RP, Lee H-J, Singh H. PU.1 regulates expression of the Interleukin-7 receptor in lymphoid progenitors. Immunity. 2002;16:297–309. - PubMed
    1. Donaldson IJ, Chapman M, Kinston S, Landry JR, Knezevic K, Piltz S, Buckley N, Green AR, Gottgens B. Genome-wide identification of cis-regulatory sequences controlling blood and endothelial development. Hum. Mol. Genet. 2005;14:595–601. - PubMed

Publication types

Associated data