

Differential diffusivity of Nodal and Lefty underlies a reaction-diffusion patterning system
- PMID: 22499809
- PMCID: PMC3525670
- DOI: 10.1126/science.1221920
Differential diffusivity of Nodal and Lefty underlies a reaction-diffusion patterning system
Abstract
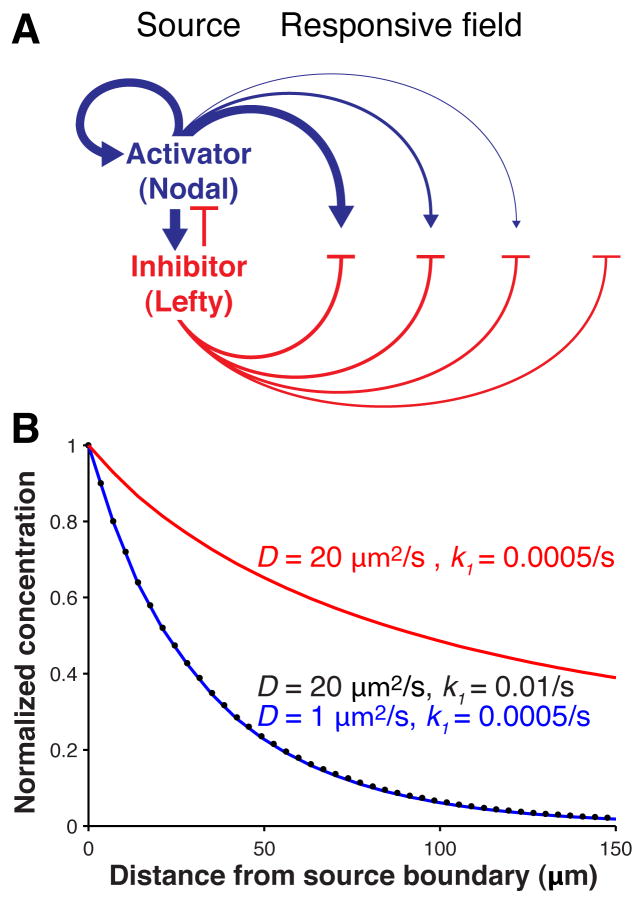
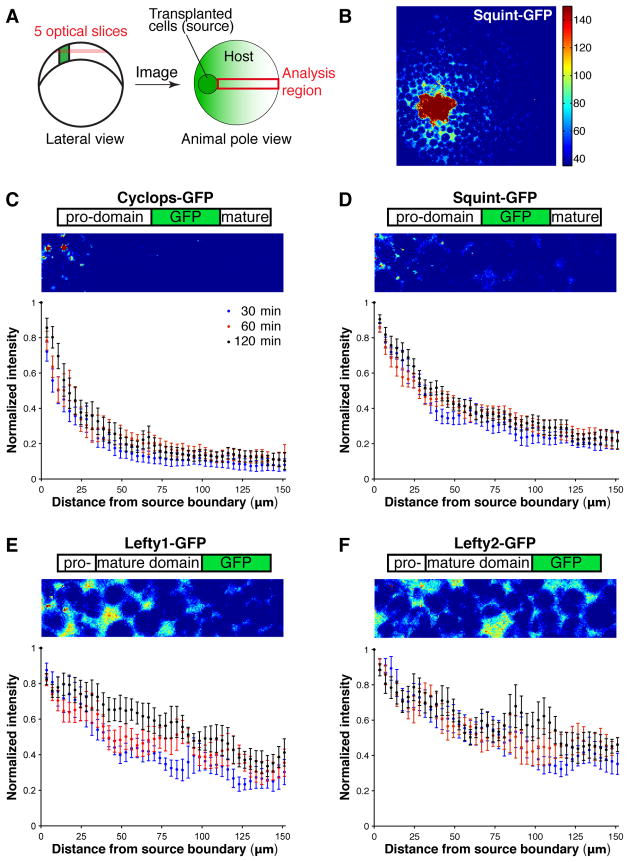
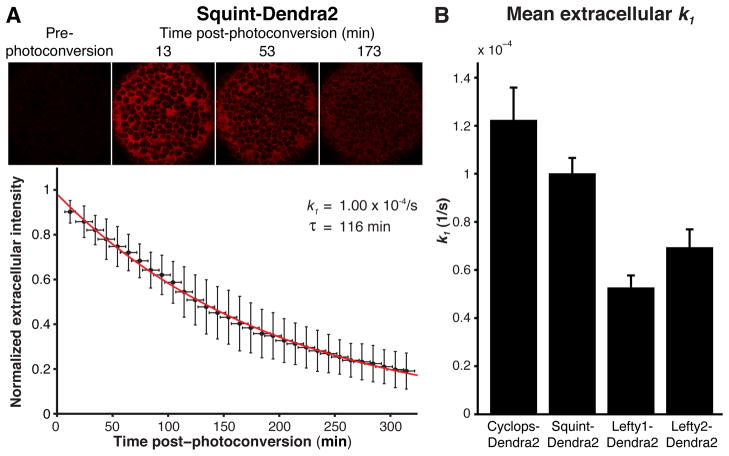
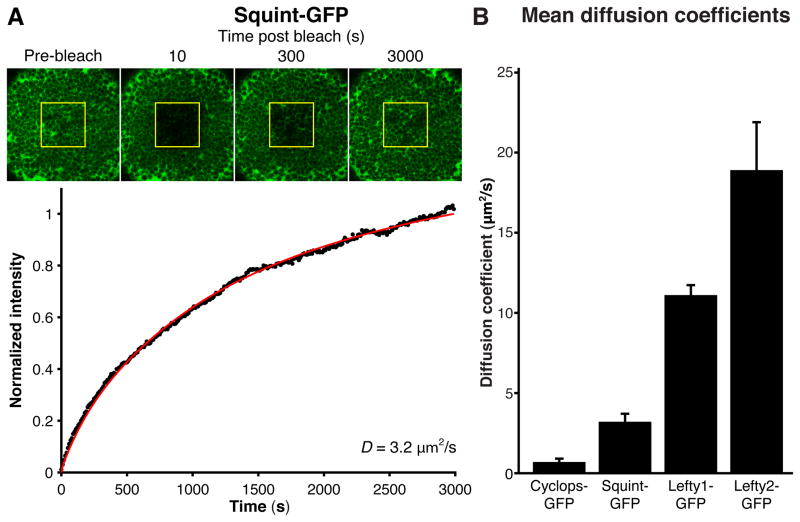
Biological systems involving short-range activators and long-range inhibitors can generate complex patterns. Reaction-diffusion models postulate that differences in signaling range are caused by differential diffusivity of inhibitor and activator. Other models suggest that differential clearance underlies different signaling ranges. To test these models, we measured the biophysical properties of the Nodal/Lefty activator/inhibitor system during zebrafish embryogenesis. Analysis of Nodal and Lefty gradients revealed that Nodals have a shorter range than Lefty proteins. Pulse-labeling analysis indicated that Nodals and Leftys have similar clearance kinetics, whereas fluorescence recovery assays revealed that Leftys have a higher effective diffusion coefficient than Nodals. These results indicate that differential diffusivity is the major determinant of the differences in Nodal/Lefty range and provide biophysical support for reaction-diffusion models of activator/inhibitor-mediated patterning.
Figures
Comment in
-
In search of Turing in vivo: understanding Nodal and Lefty behavior.Dev Cell. 2012 May 15;22(5):911-2. doi: 10.1016/j.devcel.2012.05.003. Dev Cell. 2012. PMID: 22595667
Similar articles
-
Scale-invariant patterning by size-dependent inhibition of Nodal signalling.Nat Cell Biol. 2018 Sep;20(9):1032-1042. doi: 10.1038/s41556-018-0155-7. Epub 2018 Jul 30. Nat Cell Biol. 2018. PMID: 30061678 Free PMC article.
-
Lefty proteins are long-range inhibitors of squint-mediated nodal signaling.Curr Biol. 2002 Dec 23;12(24):2124-8. doi: 10.1016/s0960-9822(02)01362-3. Curr Biol. 2002. PMID: 12498687
-
Extracellular interactions and ligand degradation shape the nodal morphogen gradient.Elife. 2016 Apr 21;5:e13879. doi: 10.7554/eLife.13879. Elife. 2016. PMID: 27101364 Free PMC article.
-
Nodal and BMP dispersal during early zebrafish development.Dev Biol. 2019 Mar 1;447(1):14-23. doi: 10.1016/j.ydbio.2018.04.002. Epub 2018 Apr 11. Dev Biol. 2019. PMID: 29653088 Review.
-
TGFβ signaling in establishing left-right asymmetry.Semin Cell Dev Biol. 2014 Aug;32:80-4. doi: 10.1016/j.semcdb.2014.03.029. Epub 2014 Apr 2. Semin Cell Dev Biol. 2014. PMID: 24704359 Review.
Cited by
-
Temporally coordinated signals progressively pattern the anteroposterior and dorsoventral body axes.Semin Cell Dev Biol. 2015 Jun;42:118-33. doi: 10.1016/j.semcdb.2015.06.003. Epub 2015 Jun 27. Semin Cell Dev Biol. 2015. PMID: 26123688 Free PMC article. Review.
-
Regulatory factor identification for nodal genes in zebrafish by causal inference.Front Cell Dev Biol. 2022 Oct 20;10:1047363. doi: 10.3389/fcell.2022.1047363. eCollection 2022. Front Cell Dev Biol. 2022. PMID: 36340027 Free PMC article.
-
Long-range formation of the Bicoid gradient requires multiple dynamic modes that spatially vary across the embryo.Development. 2024 Feb 1;151(3):dev202128. doi: 10.1242/dev.202128. Epub 2024 Feb 12. Development. 2024. PMID: 38345326 Free PMC article.
-
Modelling Chemotactic Motion of Cells in Biological Tissues.PLoS One. 2016 Oct 31;11(10):e0165570. doi: 10.1371/journal.pone.0165570. eCollection 2016. PLoS One. 2016. PMID: 27798687 Free PMC article.
-
Precision of morphogen gradients in neural tube development.Nat Commun. 2022 Mar 3;13(1):1145. doi: 10.1038/s41467-022-28834-3. Nat Commun. 2022. PMID: 35241686 Free PMC article.
References
-
- Turing AM. The chemical basis of morphogenesis. Philosophical Transactions of The Royal Society of London series B. 1952:37.
-
- Gierer A, Meinhardt H. A theory of biological pattern formation. Kybernetik. 1972;12:30. - PubMed
-
- Kondo S, Miura T. Reaction-diffusion model as a framework for understanding biological pattern formation. Science. 2010;329:1616. - PubMed
-
- Shiratori H, Hamada H. The left-right axis in the mouse: from origin to morphology. Development. 2006;133:2095. - PubMed
Publication types
MeSH terms
Substances
Grants and funding
LinkOut - more resources
Full Text Sources
Other Literature Sources
Molecular Biology Databases
