

Assessing actual contribution of IF1, inhibitor of mitochondrial FoF1, to ATP homeostasis, cell growth, mitochondrial morphology, and cell viability
- PMID: 22493494
- PMCID: PMC3365700
- DOI: 10.1074/jbc.M112.345793
Assessing actual contribution of IF1, inhibitor of mitochondrial FoF1, to ATP homeostasis, cell growth, mitochondrial morphology, and cell viability
Abstract
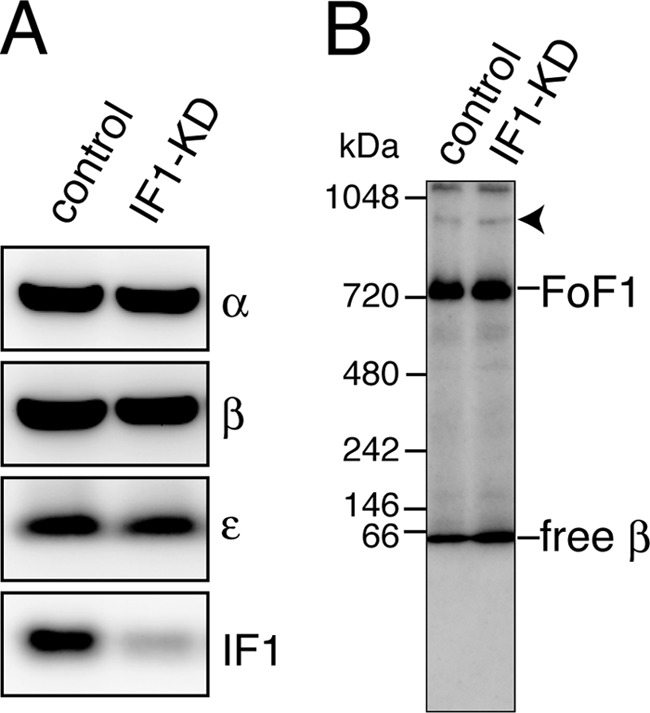
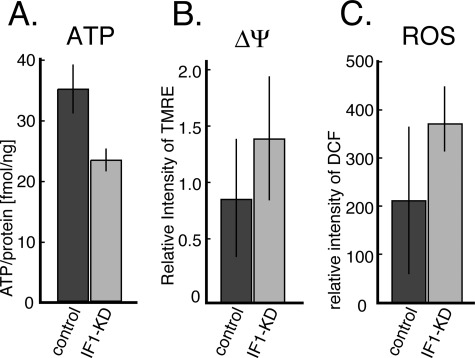
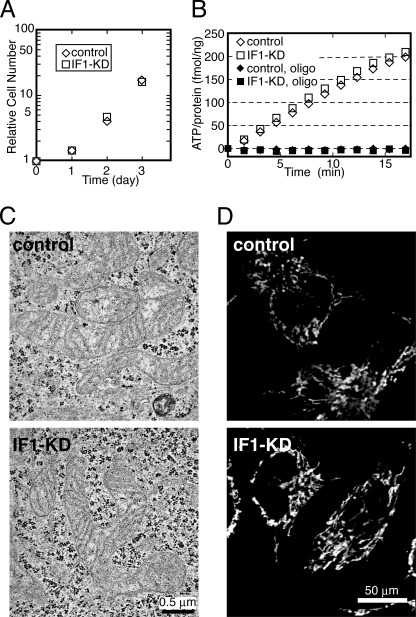
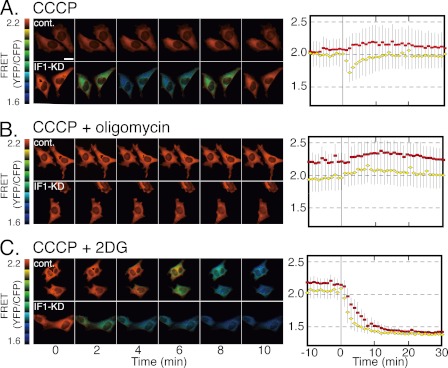
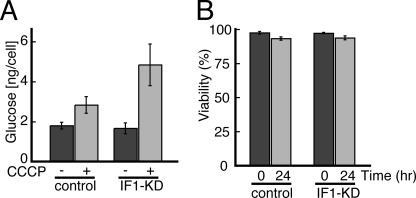
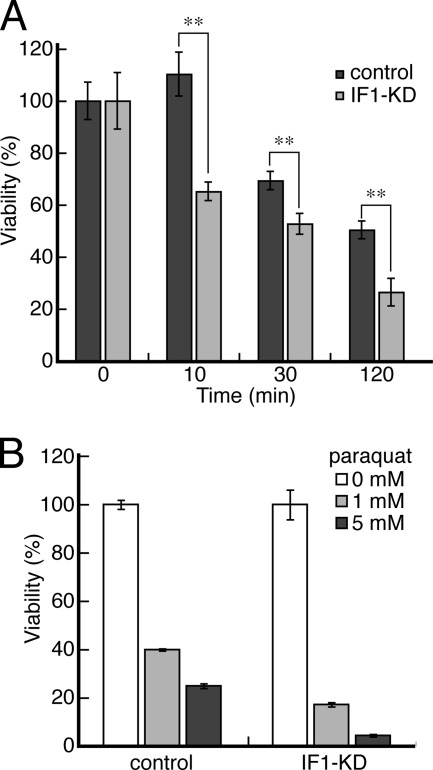
F(o)F(1)-ATP synthase (F(o)F(1)) synthesizes ATP in mitochondria coupled with proton flow driven by the proton motive force (pmf) across membranes. It has been known that isolated IF1, an evolutionarily well conserved mitochondrial protein, can inhibit the ATP hydrolysis activity of F(o)F(1). Here, we generated HeLa cells with permanent IF1 knockdown (IF1-KD cells) and compared their energy metabolism with control cells. Under optimum growth conditions, IF1-KD cells have lower cellular ATP levels and generate a higher pmf and more reactive oxygen species. Nonetheless, IF1-KD cells and control cells show the same rates of cell growth, glucose consumption, and mitochondrial ATP synthesis. Furthermore, contrary to previous reports, the morphology of mitochondria in IF1-KD cells appears to be normal. When cells encounter sudden dissipation of pmf, the cytoplasmic ATP level in IF1-KD cells drops immediately (~1 min), whereas it remains unchanged in the control cells, indicating occurrence of futile ATP hydrolysis by F(o)F(1) in the absence of IF1. The lowered ATP level in IF1-KD cells then recovers gradually (~10 min) to the original level by consuming more glucose than control cells. The viability of IF1-KD cells and control cells is the same in the absence of pmf. Thus, IF1 contributes to ATP homeostasis, but its deficiency does not affect the growth and survival of HeLa cells. Only when cells are exposed to chemical ischemia (no glycolysis and no respiration) or high concentrations of reactive oxygen species does IF1 exhibit its ability to alleviate cell injury.
Figures
Similar articles
-
IF1, the endogenous regulator of the F(1)F(o)-ATPsynthase, defines mitochondrial volume fraction in HeLa cells by regulating autophagy.Biochim Biophys Acta. 2009 May;1787(5):393-401. doi: 10.1016/j.bbabio.2009.02.023. Epub 2009 Mar 5. Biochim Biophys Acta. 2009. PMID: 19269273
-
Investigation of the role and mechanism of IF1 and STF1 proteins, twin inhibitory peptides which interact with the yeast mitochondrial ATP synthase.Biochemistry. 2003 Jun 24;42(24):7626-36. doi: 10.1021/bi034394t. Biochemistry. 2003. PMID: 12809520
-
The shrimp mitochondrial FoF1-ATPase inhibitory factor 1 (IF1).J Bioenerg Biomembr. 2015 Oct;47(5):383-93. doi: 10.1007/s10863-015-9621-0. Epub 2015 Aug 25. J Bioenerg Biomembr. 2015. PMID: 26302886
-
The Multifaceted ATPase Inhibitory Factor 1 (IF1) in Energy Metabolism Reprogramming and Mitochondrial Dysfunction: A New Player in Age-Associated Disorders?Antioxid Redox Signal. 2022 Aug;37(4-6):370-393. doi: 10.1089/ars.2021.0137. Epub 2022 Jan 4. Antioxid Redox Signal. 2022. PMID: 34605675 Free PMC article. Review.
-
The F1Fo-ATPase inhibitor, IF1, is a critical regulator of energy metabolism in cancer cells.Biochem Soc Trans. 2021 Apr 30;49(2):815-827. doi: 10.1042/BST20200742. Biochem Soc Trans. 2021. PMID: 33929490 Review.
Cited by
-
The F0F1 ATP Synthase Complex Localizes to Membrane Rafts in Gonadotrope Cells.Mol Endocrinol. 2016 Sep;30(9):996-1011. doi: 10.1210/me.2015-1324. Epub 2016 Aug 2. Mol Endocrinol. 2016. PMID: 27482602 Free PMC article.
-
Mitochondrial remodeling and ischemic protection by G protein-coupled receptor 35 agonists.Science. 2022 Aug 5;377(6606):621-629. doi: 10.1126/science.abm1638. Epub 2022 Aug 4. Science. 2022. PMID: 35926043 Free PMC article.
-
The Pro-Oncogenic Protein IF1 Promotes Proliferation of Anoxic Cancer Cells during Re-Oxygenation.Int J Mol Sci. 2023 Sep 27;24(19):14624. doi: 10.3390/ijms241914624. Int J Mol Sci. 2023. PMID: 37834071 Free PMC article.
-
Benzoylaconine Protects Skeletal Muscle Against Ischemia-Reperfusion Injury Through Activation of IF1-Dependent AMPK/Nrf2 Axis.Drug Des Devel Ther. 2024 Jun 10;18:2125-2142. doi: 10.2147/DDDT.S456699. eCollection 2024. Drug Des Devel Ther. 2024. PMID: 38882050 Free PMC article.
-
The potential role of mitochondrial ATP synthase inhibitory factor 1 (IF1) in coronary heart disease: a literature review.Lipids Health Dis. 2017 Feb 7;16(1):35. doi: 10.1186/s12944-017-0430-9. Lipids Health Dis. 2017. PMID: 28173810 Free PMC article. Review.
References
-
- Pullman M. E., Monroy G. C. (1963) A naturally occurring inhibitor of mitochondrial adenosine triphosphatase. J. Biol. Chem. 238, 3762–3769 - PubMed
-
- Ichikawa N., Ushida S., Kawabata M., Masazumi Y. (1999) Nucleotide sequence of cDNA coding the mitochondrial precursor protein of the ATPase inhibitor from humans. Biosci. Biotechnol. Biochem. 63, 2225–2227 - PubMed
-
- Ichikawa N., Yoshida Y., Hashimoto T., Ogasawara N., Yoshikawa H., Imamoto F., Tagawa K. (1990) Activation of ATP hydrolysis by an uncoupler in mutant mitochondria lacking an intrinsic ATPase inhibitor in yeast. J. Biol. Chem. 265, 6274–6278 - PubMed
-
- Aggeler R., Coons J., Taylor S. W., Ghosh S. S., Garcia J. J., Capaldi R. A., Marusich M. F. (2002) A functionally active human F1Fo-ATPase can be purified by immunocapture from heart tissue and fibroblast cell lines. Subunit structure and activity studies. J. Biol. Chem. 277, 33906–33912 - PubMed
Publication types
MeSH terms
Substances
LinkOut - more resources
Full Text Sources
Miscellaneous
