. 2012 May;22(5):836-47.
doi: 10.1038/cr.2012.56. Epub 2012 Apr 10.

NLRC5 regulates MHC class I antigen presentation in host defense against intracellular pathogens

Affiliations

NLRC5 regulates MHC class I antigen presentation in host defense against intracellular pathogens

Yikun Yao et al. Cell Res. 2012 May.

Abstract

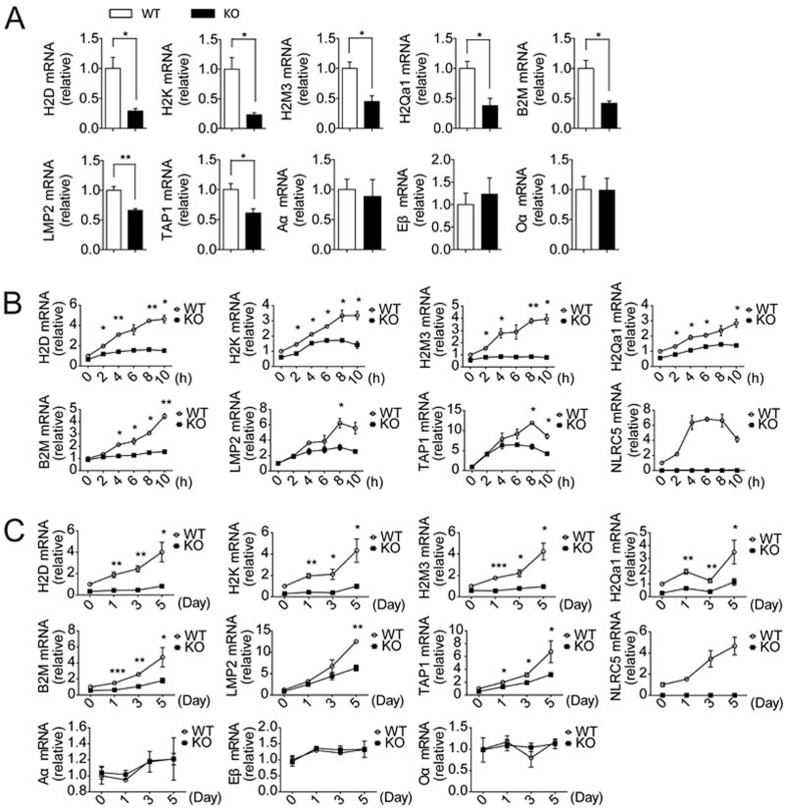
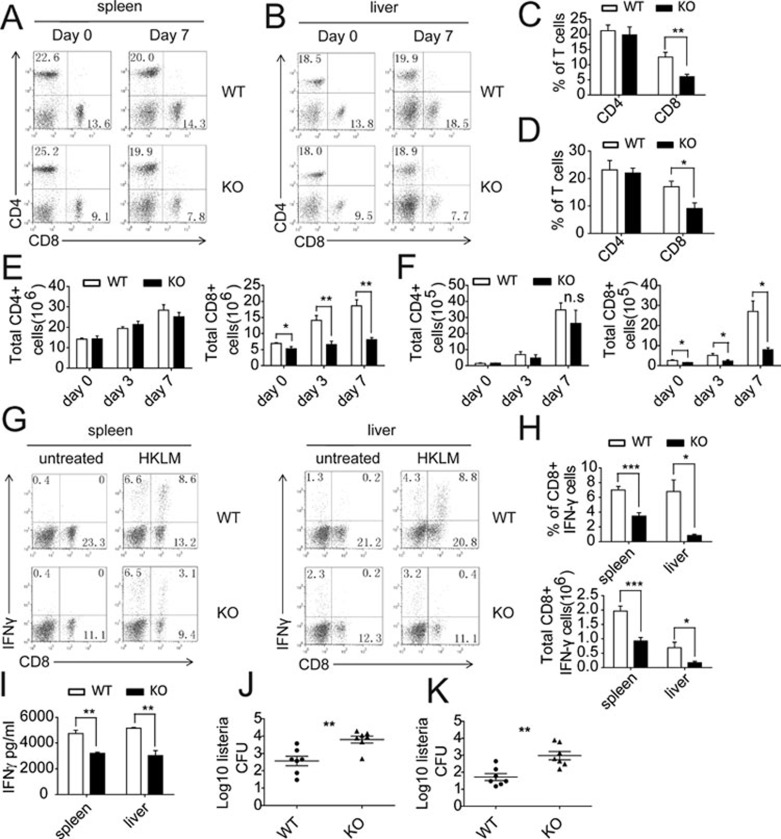
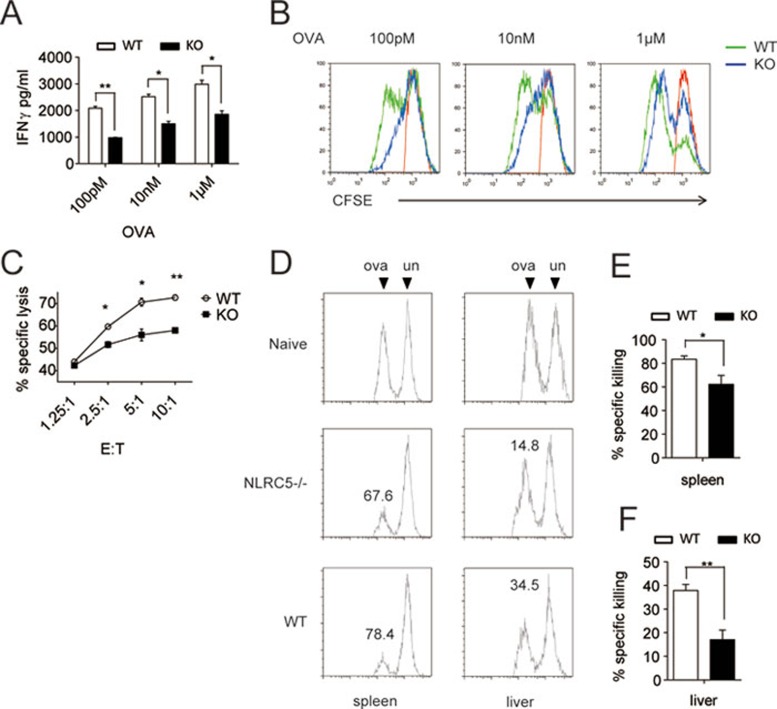
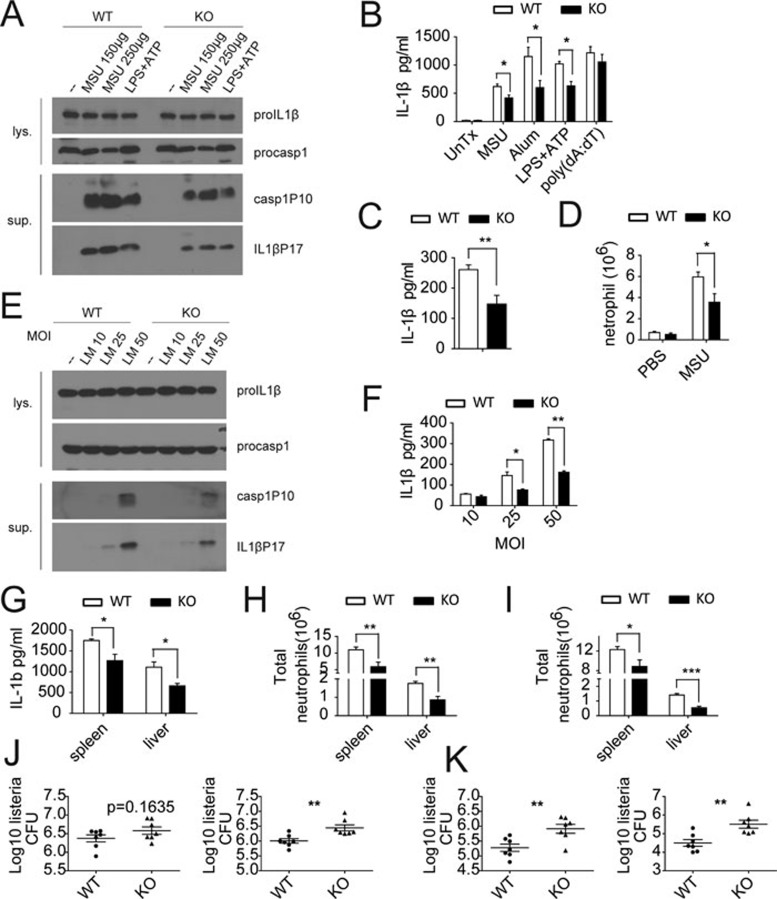
NOD-like receptors (NLRs) are a family of intracellular proteins that play critical roles in innate immunity against microbial infection. NLRC5, the largest member of the NLR family, has recently attracted much attention. However, in vitro studies have reported inconsistent results about the roles of NLRC5 in host defense and in regulating immune signaling pathways. The in vivo function of NLRC5 remains unknown. Here, we report that NLRC5 is a critical regulator of host defense against intracellular pathogens in vivo. NLRC5 was specifically required for the expression of genes involved in MHC class I antigen presentation. NLRC5-deficient mice showed a profound defect in the expression of MHC class I genes and a concomitant failure to activate L. monocytogenes-specific CD8(+) T cell responses, including activation, proliferation and cytotoxicity, and the mutant mice were more susceptible to the pathogen infection. NLRP3-mediated inflammasome activation was also partially impaired in NLRC5-deficient mice. However, NLRC5 was dispensable for pathogen-induced expression of NF-κB-dependent pro-inflammatory genes as well as type I interferon genes. Thus, NLRC5 critically regulates MHC class I antigen presentation to control intracellular pathogen infection.


Figures

Figure 1
Figure 1
NLRC5 specifically regulates the expression of genes involved in MHC class I antigen presentation. (A) Quantitative RT-PCR analysis of MHC class Ia genes (H2D and H2K), MHC class Ib genes (H2M3 and H2Qa1), MHC class I functionally relative genes (B2M, LMP2 and TAP1) and MHC class II genes (Aα, Bβ, Oα) in the spleen tissues from Nlrc5+/+ (WT) and Nlrc5−/− (KO) mice. (B) Quantitative RT-PCR analysis of those MHC class I genes and MHC class I-related genes as indicated in A in bone marrow-derived macrophages from Nlrc5+/+ (WT) and Nlrc5−/− (KO) mice that were unstimulated or stimulated with LPS (100 ng/ml) for the indicated times. (C) Quantitative RT-PCR analysis of the genes indicated in B in the spleen tissues from Nlrc5+/+ (WT) and Nlrc5−/− (KO) mice infected i.v. with 2 × 10⁴ colony-forming units (CFU) of LM for the indicated times. *P < 0.05; **P < 0.01; ***P < 0.001 (Student's t-test). Data represent three independent experiments (n = 4; mean ± SEM in A-C).
Figure 2
Figure 2
NLRC5 regulates CD8+ T cell activation to constrain LM infection. (A, B) Splenocytes (A) or hepatic leukocytes (B) were harvested from Nlrc5+/+ (WT) and Nlrc5−/− (KO) mice infected i.v. with LM (2 × 10⁴ CFU) for 7 days, and stained with antibodies against CD8α-FITC and CD4-PE for flow cytometry analysis. Numbers in the quadrant indicate the percentage of cells. (C, D) Bar graphs represent the percentage of CD4+ or CD8+ T cells in the spleen (C) or liver (D). (E, F) Splenocytes (E) or hepatic leukocytes (F) from WT and Nlrc5−/− (KO) mice infected as in A for the indicated times were analyzed by flow cytometry for the total number of CD4+ or CD8+ T cells per spleen (E) or per liver (F). (G) Splenocytes or hepatic leukocytes isolated from WT and Nlrc5−/− (KO) mice infected as in A were untreated or stimulated with HKLM overnight. Cells were then stained with antibodies against CD8α-FITC and IFN-γ-PE and analyzed by flow cytometry. Numbers in the quadrant indicate the percentage of cells. (H) Bar graphs represent the percentage or total number of CD8+IFN-γ+ T cells. (I) IFN-γ level in the supernatant of the cultured cells as in G was measured by ELISA. (J, K) Bacterial burden was determined in the spleens (J) and livers (K) of WT and Nlrc5−/− (KO) mice infected as in A. *P < 0.05; **P < 0.01; ***P < 0.001 (Student's t-test). Data are representative of three (A-B, J-K) or two (C-F, H-I) independent experiments (n = 4; mean ± SEM in C-F, H-K).
Figure 3
Figure 3
NLRC5 regulates MHC class I-mediated CD8+ T cell activation, proliferation and cytotoxicity. (A, B) Purified naive OT-1 CD8+ T cells labeled with 4 μM CFSE were cultured with WT or Nlrc5/− (KO) BMDCs that had been pulsed with OVA at a series of concentrations (from 100 pM to 1 μM) at a ratio of 3:1 in plate-bound assays for 3 days. IFN-γ levels in the supernatant were determined by ELISA and represent T cell activation (A). CFSE intensity in T cells was determined by flow cytometry, representing OT-1 CD8+ T cell proliferation (B). (C) OT-1 T cells were treated with OVA peptide and used as effector cells. BMDCs from WT or Nlrc5−/− mice were pulsed with OVA (100 pM) for 1 h at 37 °C and used as target cells. The effector and target cells were co-cultured at the ratios indicated. Cytotoxic T lymphocyte-mediated killing was determined by LDH release using a cytotoxicity detection kit. (D) C57BL/6 splenocytes labeled with CFSE were untreated (un) or OVA-pulsed (ova), then co-injected i.v. into naive mice or Nlrc5−/− and wild-type (WT) control mice that had been infected with LM-OVA (2 × 10⁴ CFU) for three days. In vivo cytolysis was assessed 16 h later by flow cytometry. Histograms were gated on CFSE-positive target cells, and the numbers above each peak represent the percent of specific killing, which was calculated as described in Materials and Methods. (E, F) Bar graphs indicate the percentage of specific lysis in the spleen (E) or liver (F) as analyzed in D. *P < 0.05; **P < 0.01 (Student's t-test). Data are representative of three (A-C, n = 3) or two (D-F, n= 4) independent experiments (mean ± SEM in A, C, E, F).
Figure 4
Figure 4
NLRC5 partially regulates inflammasome activation. (A, B) Bone marrow-derived macrophages (BMMs) from wild-type (WT) or Nlrc5−/− (KO) mice were primed with LPS (500 ng/ml) for 6 h and subsequently stimulated with MSU (150 μg/ml or 250 μg/ml), alum (500 μg/ml), LPS (500 ng/ml) + ATP (5 mM) or poly(dA:dT) (1 μg/ml) for 6 h. Immunoblotting of cell lysates and culture supernatants was performed with the indicated antibodies for caspase-1 and IL-1β cleavage (A). Supernatants were also analyzed for IL-1β by ELISA (B). (C, D) WT or Nlrc5−/− (KO) mice were injected intraperitoneally with PBS (control) or MSU crystals (2 mg per mouse). Neutrophil influx was quantified 6 h later by flow cytometry (D), and supernatants of the influx were analyzed for IL-1β by ELISA (C). (E) BMMs from WT mice or Nlrc5−/− (KO) mice were primed with LPS (500 ng/ml) for 3 h and subsequently infected with the indicated doses of LM for 30 min. Immunoblotting of cell lysates and culture supernatants was performed with the indicated antibodies for caspase-1 and IL-1β cleavage (E). Supernatants were also analyzed for IL-1β by ELISA (F). (G) Spleens and livers from WT and Nlrc5−/− (KO) mice infected with LM for 1 day were homogenized, and the supernatants were evaluated for IL-1β cleavage by ELISA. (H, I) Splenocytes or hepatic leukocytes from WT and Nlrc5−/− (KO) mice infected with LM for 1 day (H) or three days (I) were stained with the antibodies anti-CD11b-FITC and anti-Ly6G-PE to quantify the neutrophils by flow cytometry. (J, K) Bacterial burden was determined in the spleens and livers of WT and Nlrc5−/− (KO) mice infected with LM for 1 day (J) or three days (K). *P < 0.05; **P < 0.01; ***P < 0.001 (Student's t-test). Data are representative of three independent experiments (A-G, n = 3; H-I, n = 4; J-K, n = 7) (mean ± SEM in B-D, F-K).
Figure 5
Figure 5
NLRC5 is dispensable for pathogen-induced expression of NF-κB-dependent genes and the IFN-β gene. (A) BMMs from Nlrc5+/+ (WT) or Nlrc5−/− (KO) mice were infected with LM (MOI = 50) for the indicated times. The expression of NF-κB-dependent genes (IL-6, TNFα, IL-1β, and IL-10) was determined by quantitative real-time PCR. (B, C) BMMs from Nlrc5+/+ (WT) or Nlrc5−/− (KO) mice were transfected with poly(dA:dT) (1 μg/ml) (B) or poly(I:C) (1 μg/ml) (C) for the indicated times. IFN-β expression was determined by quantitative real-time PCR. (D) IFN-β expression was determined in the BMMs infected as in A, by quantitative real-time PCR. Data are representative of three independent experiments (A-D) (n = 4; mean ± SEM in A-D).

Similar articles

Cited by

References

    1. Schroder K, Tschopp J. The inflammasomes. Cell. 2010;140:821–832. - PubMed
    1. Elinav E, Strowig T, Henao-Mejia J, Flavell RA. Regulation of the antimicrobial response by NLR proteins. Immunity. 2011;34:665–679. - PubMed
    1. Kanneganti TD. Central roles of NLRs and inflammasomes in viral infection. Nat Rev Immunol. 2010;10:688–698. - PMC - PubMed
    1. Kanneganti TD, Lamkanfi M, Núñez G. Intracellular NOD-like receptors in host defense and disease. Immunity. 2007;27:549–559. - PubMed
    1. Davis BK, Wen H, Ting JP. The inflammasome NLRs in immunity, inflammation, and associated diseases. Annu Rev Immunol. 2011;29:707–735. - PMC - PubMed

Publication types

MeSH terms