

Use of CID/ETD mass spectrometry to analyze glycopeptides
- PMID: 22470127
- PMCID: PMC3673024
- DOI: 10.1002/0471140864.ps1211s68
Use of CID/ETD mass spectrometry to analyze glycopeptides
Abstract
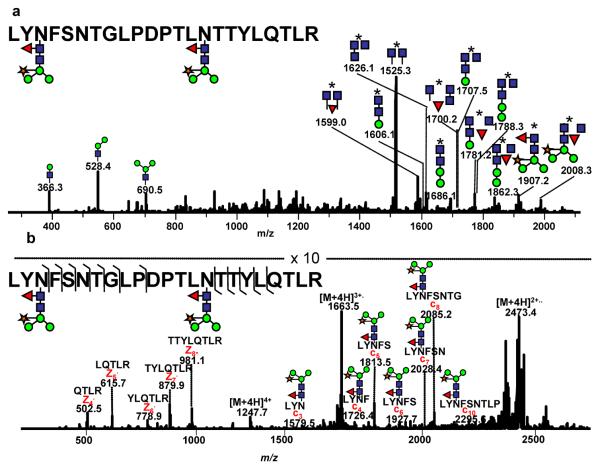
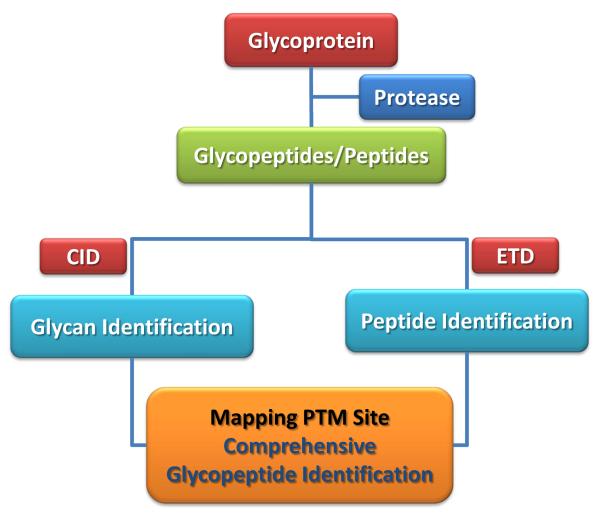
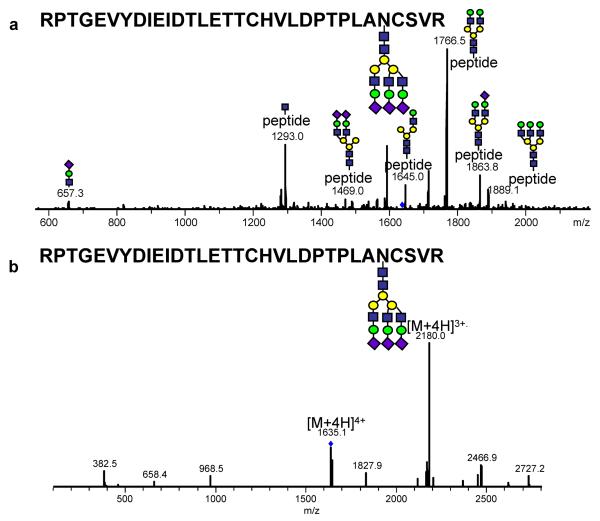
Collision-induced dissociation (CID) tandem mass spectrometry (MS/MS) does not allow the characterization of glycopeptides because of the fragmentation of glycan structures and limited fragmentation of peptide backbones. Electron transfer dissociation (ETD) MS/MS, on the other hand, offers a complementary approach, prompting only peptide backbone fragmentation while keeping post-translational modifications intact. Characterization of glycopeptides using both CID and ETD is summarized in this unit. While CID provides information related to the composition of glycan moieties attached to a peptide backbone, ETD permits de novo sequencing of peptides. Radical anion transfer of electrons to the peptide backbone in ETD induces cleavage of the N-Cα bond. The glycan moiety is retained on the peptide backbone, largely unaffected by the ETD process, thus allowing the identification of the amino acid sequence of a glycopeptide and its glycosylation site. This unit discusses the use of both CID and ETD for better characterization of glycopeptides.
© 2012 by John Wiley & Sons, Inc.
Figures
Similar articles
-
Characterization of glycopeptides by combining collision-induced dissociation and electron-transfer dissociation mass spectrometry data.Rapid Commun Mass Spectrom. 2009 Jan;23(1):161-70. doi: 10.1002/rcm.3850. Rapid Commun Mass Spectrom. 2009. PMID: 19065542
-
Simultaneous glycan-peptide characterization using hydrophilic interaction chromatography and parallel fragmentation by CID, higher energy collisional dissociation, and electron transfer dissociation MS applied to the N-linked glycoproteome of Campylobacter jejuni.Mol Cell Proteomics. 2011 Feb;10(2):M000031-MCP201. doi: 10.1074/mcp.M000031-MCP201. Epub 2010 Apr 1. Mol Cell Proteomics. 2011. PMID: 20360033 Free PMC article.
-
On-line LC-MS approach combining collision-induced dissociation (CID), electron-transfer dissociation (ETD), and CID of an isolated charge-reduced species for the trace-level characterization of proteins with post-translational modifications.J Proteome Res. 2007 Nov;6(11):4230-44. doi: 10.1021/pr070313u. Epub 2007 Sep 28. J Proteome Res. 2007. PMID: 17900180 Free PMC article.
-
Recent developments and applications of electron transfer dissociation mass spectrometry in proteomics.Amino Acids. 2014 Jul;46(7):1625-34. doi: 10.1007/s00726-014-1726-y. Epub 2014 Apr 1. Amino Acids. 2014. PMID: 24687149 Review.
-
[Recent advances in glycopeptide enrichment and mass spectrometry data interpretation approaches for glycoproteomics analyses].Se Pu. 2021 Oct;39(10):1045-1054. doi: 10.3724/SP.J.1123.2021.06011. Se Pu. 2021. PMID: 34505426 Free PMC article. Review. Chinese.
Cited by
-
Dissecting the Components of Sindbis Virus from Arthropod and Vertebrate Hosts: Implications for Infectivity Differences.ACS Infect Dis. 2019 Jun 14;5(6):892-902. doi: 10.1021/acsinfecdis.8b00356. Epub 2019 Apr 15. ACS Infect Dis. 2019. PMID: 30986033 Free PMC article.
-
Tool for Rapid Analysis of Glycopeptide by Permethylation via One-Pot Site Mapping and Glycan Analysis.Anal Chem. 2017 Oct 17;89(20):10734-10743. doi: 10.1021/acs.analchem.7b01730. Epub 2017 Oct 2. Anal Chem. 2017. PMID: 28921966 Free PMC article.
-
Use of an informed search space maximizes confidence of site-specific assignment of glycoprotein glycosylation.Anal Bioanal Chem. 2017 Jan;409(2):607-618. doi: 10.1007/s00216-016-9970-5. Epub 2016 Oct 12. Anal Bioanal Chem. 2017. PMID: 27734143 Free PMC article.
-
Glycan size and attachment site location affect electron transfer dissociation (ETD) fragmentation and automated glycopeptide identification.Glycoconj J. 2019 Dec;36(6):487-493. doi: 10.1007/s10719-019-09888-w. Epub 2019 Oct 21. Glycoconj J. 2019. PMID: 31637569
-
Glycosylation of recombinant adeno-associated virus serotype 6.Mol Ther Methods Clin Dev. 2024 Apr 25;32(2):101256. doi: 10.1016/j.omtm.2024.101256. eCollection 2024 Jun 13. Mol Ther Methods Clin Dev. 2024. PMID: 38774582 Free PMC article.
References
-
- Adamson JT, Hakansson K. J. Proteome Res. 2006;5:493–501. - PubMed
-
- Alley WR, Mechref Y, Novonty MV. Characterization of glycopeptides by combining collision-induced dissociation and electron-transfer dissociation mass spectrometry data. Rapid Commun. Mass Spectrom. 2009;23:161–170. - PubMed
-
- Anusiewicz I, Berdys-Kochanska J, Simons JA. J. Phys. Chem. 2005;109:5801–5813. - PubMed
-
- Bertozzi CR, Kiessling LL. Chemical Glycobiology. Science. 2001;291:2357–2364. - PubMed
-
- Catalina MI, Koeleman CAM, et al. Rapid Commun. Mass Spectrom. 2007;21:1053–1061. - PubMed
Publication types
MeSH terms
Substances
Grants and funding
LinkOut - more resources
Full Text Sources
Other Literature Sources
